Editor’s note: Erik Coats is executive vice president, Cristina Ilangakoon is senior associate and Michael Feehan is CEO at Waltham, Mass., research company Observant LLC.
Two of the most ubiquitous question batteries in quantitative market research are those in which a list of attributes are rated on 1) their importance in buying decisions, and 2) strength of association with any specific brands. The value of these questions is obvious, and indeed it would be difficult to exaggerate their importance to marketers. They provide a picture of the critical needs of potential consumers and how a brand’s value proposition stands on its ability to fulfill those needs relative to competitors. Because these questions work together to provide this important picture, they are often referred to collectively as an influential attribute assessment (or IAA).
Traditional IAA approaches hinge on consumers making effective judgments on how strongly a brand performs on any single attribute. However this two-dimensional picture (association and importance) is vulnerable in situations where consumers do not have full knowledge of the product or attribute under consideration. This is especially true when new products are considered, but even with well-established brands customers frequently have gaps in their knowledge and perceptions. We argue that the two-dimensional IAA approach can be improved by simultaneously including a third dimension - a measure we call strength of conviction.
The degree of confidence
Strength of conviction (or SoC) is the measurement of the degree of confidence a consumer has in their rating of a brand association. Asking about strength of conviction is akin to asking, “How sure are you?” For example, a consumer may feel extremely confident that an Apple iPhone has some desired quality, such as having a highly-scratch-resistant screen. However, asking about Google’s forthcoming smartphone Dragon may be more challenging. They may assume the Dragon probably has the same screen quality but would be less sure. SoC quantifies this degree of certainty so that it can be controlled for and used to improve the picture of brand performance. In other words, adding SoC can change a two-dimensional view into a more complete three-dimensional picture.
So how much does SoC really matter? Potentially quite a bit. Those who’ve conducted IAA in the past have probably already noticed weaknesses in the quality of data and inferences resulting from uncertain responding.
Always a continuum
In designing a quantitative survey, before asking consumers for brand ratings we must first decide whether or not we wish to allow a “don’t know” option. Allowing “don’t know” recognizes that consumers may have such a low degree of conviction that they should be allowed to give no answer at all. But this dichotomous view of SoC is too simplistic: something people either have or don’t. In reality, SoC is always a continuum.
Without SoC market researchers must decide between two imperfect options. Allowing “don’t know” has at least three important drawbacks. First, it allows less-diligent consumers an easy out by allowing them to essentially avoid the question. Second, it complicates analysis by permitting missing data. And third, we fail to collect data on beliefs that are weakly held but may nevertheless affect behaviors of interest.
Yet disallowing “don’t know” has its own pitfalls. It may frustrate consumers who don’t know how to rate all products on all attributes and create error in our data by forcing a response when no appropriate one is available. This error in the data is perhaps most obvious in the midpoint spike.
It is not uncommon when viewing a frequency distribution of a product-associate question to notice a spike at the midpoint in the scale (e.g., 5 on a 10-point scale). Quite often the frequency at the midpoint is greater than either side of the midpoint.
It’s likely (and widely suspected) that this midpoint spike reflects people with low SoC who didn’t know what answer to give. Having been denied a “don’t know” option, they may decide the middle answer is the safest choice. This would not be a problem if all midpoint answers reflected low SoC and if all people with low SoC gave an answer at the midpoint of the scale; but neither of these is true. Some people use the midpoint because that is their honest assessment. Moreover, some people with low SoC give an answer at the bottom or top of the scale - spiking the tails of the distribution.
In short, without a separate SoC measure, brand-associations and SoC are mixed together. The problem is likely not limited to the midpoint spike; it’s likely that SoC serves to pull many responses closer to the midpoint. For example, a person who believes a certain brand probably deserves a score of 9 may instead give it an 8 if they have moderate conviction about their answer, or even a 7 if they have less conviction. Without specifically addressing SoC in the questionnaire design there is no way to analytically untangle this muddling of product association and degree of certainty.
Self-funded study
To evaluate the potential advantages of incorporating SoC into IAAs, Observant LLC conducted a self-funded study to develop and evaluate an online questionnaire method of assessing SoC in a brand-association context. The respondents were 400 adults recruited from a general U.S. population panel. The topic of the research was understanding the importance of various characteristics about primary care physicians (PCPs) in driving their satisfaction and likelihood to continue going to him or her.
The product attributes for the IAA were 30 characteristics of PCPs. Each consumer first rated the importance that a doctor should have each of the 30 attributes. They were then randomly assigned to one of two conditions: 1) traditional IAA, or 2) IAA with SoC.
Those assigned to the traditional IAA arm rated their PCP on each of the 30 attributes in a typical format, on a 1-10 scale from “Does not Describe at All” to “Describes Completely.”
Those in the SoC condition provided data on both association and strength of conviction in a single operation. This was achieved using an interactive graphical drag-and-drop questionnaire format. It has been argued that interactive methods such as drag-and-drop improve the quality of both data collection and consumer experience (see “More satisfying satisfaction research,” Quirk’s, July 2009). In our study, consumers were shown a single attribute on a screen and asked to select one of five color-coded markers to indicate their level of conviction in their response (from 5 - “Highly Confident” [bright green] to 1 - “Not at all Confident” [dark red]). They then dragged that marker onto the association 1-10 scale at the point that indicated their association. This one-step process to measure two dimensions simultaneously was then repeated for all other attributes. We initially verified that attributes do in fact vary with respect to strength of conviction. Top-2 box SoC (confident or extremely confident) ranged from a high of 91 percent (“has a clean and comfortable waiting and exam room” and “office staff is friendly and helpful”) to a low of 54 percent (“runs an environmentally-clean practice”).
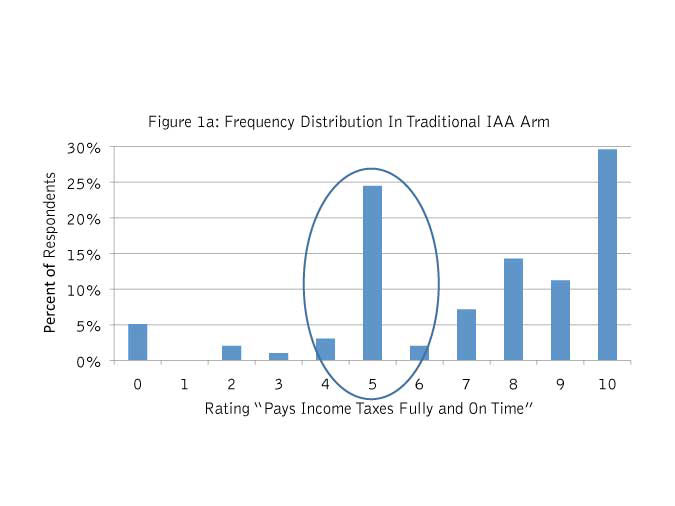
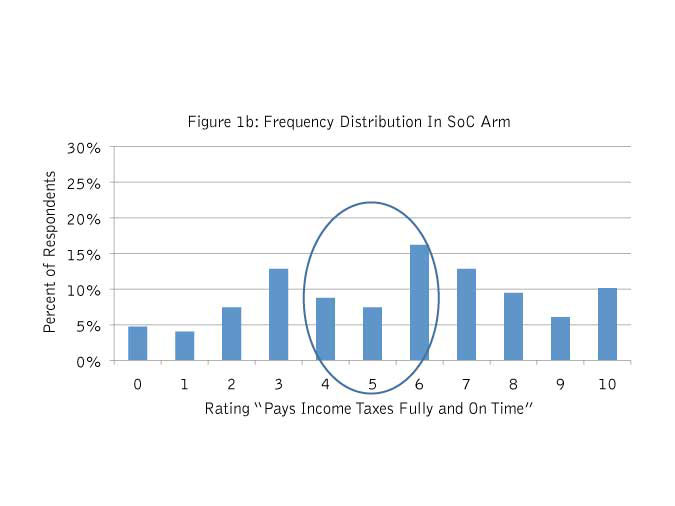
We then looked to see whether including SoC eliminated the midpoint spike. Figure 1a shows the frequency distribution of the attribute “pays income taxes fully and on time” in the traditional IAA arm; whereas Figure 1b shows the distribution for the same attribute in the SoC arm. As expected, the midpoint spike is observed for the traditional method but not the SoC method.
Predict consumer behavior
The most important test of the utility of including SoC is exploring whether it improves our ability to predict consumer behavior. To test the hypothesis that SoC would provide manifestly different interpretations, we asked all respondents to answer questions about their satisfaction with their doctor and the likelihood that they would switch to a new PCP in the near future. Attribute ratings were then used to predict their intent to stay with or change their doctors using structural equation modeling (SEM).
Comparing SEM models based on the control condition with those of the SoC condition clearly demonstrate the superiority of the SoC approach. As can be seen in Figure 2, in the traditional arm only the factor of “approachability” significantly predicted “intend to stay.” In the SoC arm, both “approachability” and “medical knowledge” significantly predict “intend to stay.” It is perhaps not surprising that SoC improved predictive ability for “medical knowledge,” as this is an area where there is greater variability in people’s level of conviction about their ratings.
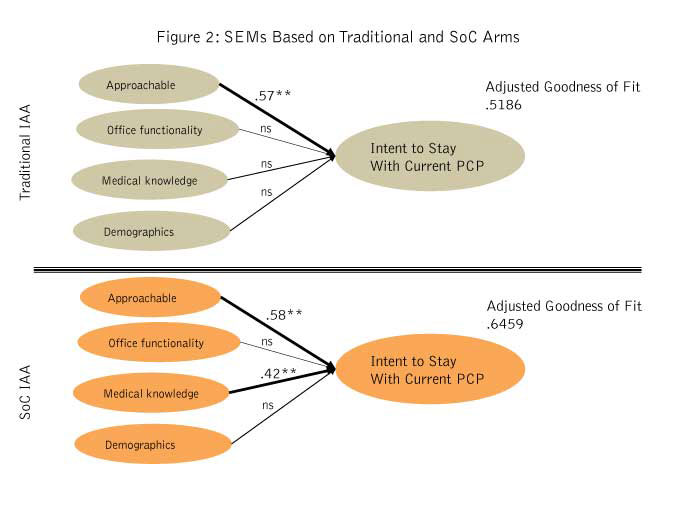
The SoC approach also performs significantly better on objective goodness-of-fit indices. The overall adjusted goodness-of-fit index is .6459 for the SoC arm but only .5186 for the traditional arm. This confirms that the data collected using SoC are superior in their ability to predict relevant behavioral intentions.
Improves our ability
The advantages of SoC are no mere academic exercise. Adding SoC to a traditional IAA task improves our ability to predict future customer behavior. In our example, we could envisage a program being developed to improve physician perceptions among their patients (and thereby enhance medication adherence with improved public health outcomes). Without considering SoC, such a program would miss the boat and prioritize only one key dimension. With more accurate SoC data, the program would correctly target two aspects of physicians’ practices to improve. By measuring the confidence our respondents have in their answers, we market researchers can improve our own confidence in the insights we deliver to our clients through improved IAA.