Editor’s note: Albert Madansky is vice president of the Analytical Group Inc., a Scottsdale, Ariz., research firm. He is also H.G.B. professor emeritus of business administration at the Booth Graduate School of Business, University of Chicago.
Market researchers have always been troubled by the difficulty of the task of obtaining reliable responses when the respondent is asked to rank a large number of items.1 In the early days of market research, when personal interviewing was the primary mode, various devices, such as the sort board, were recommended as aids in eliciting reliable responses. As market research moved toward telephone interviewing and Web-based surveys the difficulties associated with the ranking task were exacerbated, and two alternative elicitation techniques have been espoused: paired comparison and maximum difference. Though these techniques have simplified the response task, the concomitant move, from face-to-face interviewing to responding to a live interviewer by phone and finally to responding to a computer screen, has successively removed the effect that the interviewer has on the responses. For, as will be seen later, both the paired comparisons and the maximum difference set of queries can lead to inconsistent responses. And with the successively greater distancing of the interviewer from the respondent, there is greater likelihood that these inconsistencies will be unchecked. (Of course, the computer-assisted interview can, if programmed properly, check for such inconsistencies and proceed with an interrogation designed to rectify the inconsistent responses. But this requires special programming attention in the design of the interviewing script.)
The purpose of this note is, by means of an example, to illustrate the data interpretation issues associated with each of these methods. What we will see is that, unless they are carried out in full, in both the paired comparisons and maximum difference surveys, the preference proportions observed or inferred from the interview about some of the pairings will be based on sample sizes that are far short of the full sample size of the study. Moreover, these sample sizes are randomly determined, and so preference proportions based on these observations will not have the statistical properties of ordinary proportions. Consequently, standard statistical inferences made from these proportions (based on assumptions of binomial distributions with fixed sample size) may not be correct.2 Indeed, it’s not clear whether these proportions are unbiased estimates of the population preference proportions.
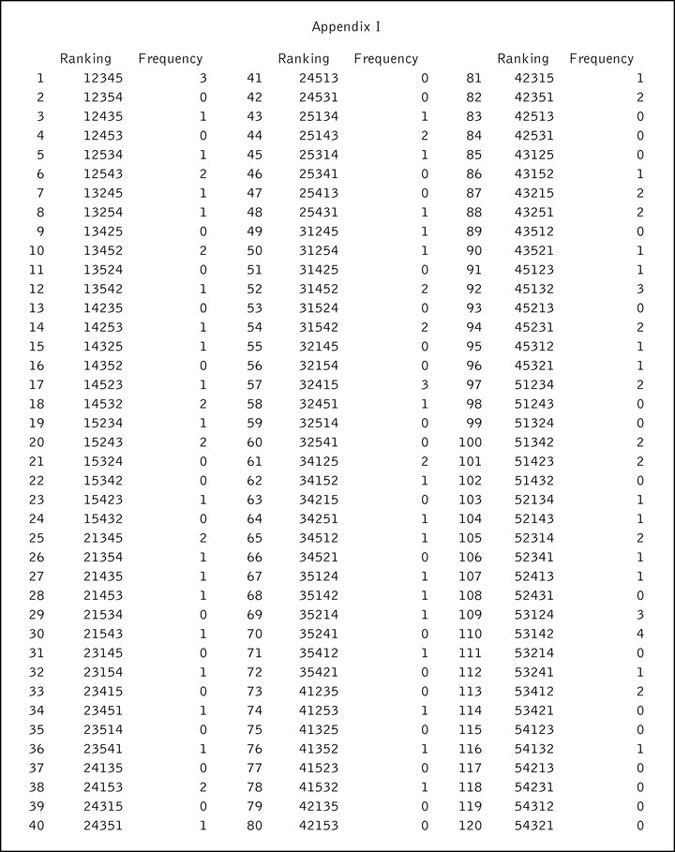
My example is based on a sample of 100 rankings of five items. There are 5!=120 different possible rankings, and Appendix I (see below) contains the frequency of occurrence of each of these rankings, so that the reader can use the data and try other combinations of pairings or best/worst elicitations than those illustrated in this article to see what results one would get. The rankings are the order of preference of the five items, with the convention that the items are ranked from most preferred to least preferred. Thus 13542 means that Product 1 is most preferred (it got listed first), followed by Product 3 (it got listed next), then by Product 5 (it got listed third), then by Product 4 (it got listed fourth), and that Product 2 is the least preferred (it got listed last).
Easy to answer
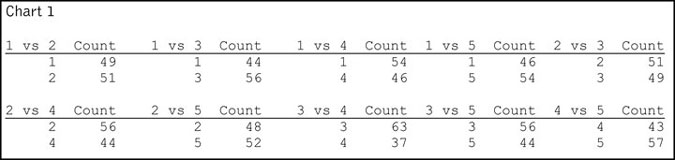
The idea behind using paired comparisons instead of ranking is that the task of answering the question, “Which do you prefer, Item A or Item B?” is easy to answer. When there are five items there are 10 different pairs about which one can ask this question. As a baseline, Chart 1 is a table of what the responses of our sample of 100 would have been if they were asked about all 10 paired comparisons. (Being that the sample size is 100, you can also read these counts as percentages.)
But being interrogated about all 10 paired comparisons is also tedious. And so market researchers may ask the respondent to do only a subset of the 10 paired comparisons, and logically infer what the respondent would have said if he/she were presented with the remainder of the paired comparisons. One popular subset is what I call the daisy chain subset. An example in this case would be these five sets: 1 vs. 2, 2 vs. 3, 3 vs. 4, 4 vs. 5, and 1 vs. 5.
From this one might, for example, attempt to infer what the respondent would have done on the 1 vs. 3 comparison by looking at the responses to 1 vs. 2 and 2 vs. 3. If Item 1 is preferred to Item 2 in the first pairing and Item 2 is preferred to Item 3 in the second pairing, then logically the respondent would prefer Item 1 to Item 3. Chart 2 is a listing of all the inferences that could be made based on the responses to two of the paired comparisons.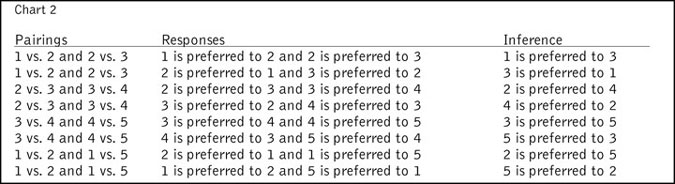
One might also attempt to infer what the respondent would have done on the 1 vs. 3 comparison by looking at the responses to 1 vs. 5, 4 vs. 5, and 3 vs. 4. If Item 1 is preferred to Item 5 in the first pairing and Item 5 is preferred to Item 4 in the second pairing, and Item 4 is preferred to Item 3 in the third pairing, then logically the respondent would prefer Item 1 to Item 3. Chart 3 shows a listing of all the inferences that could be made based on the responses to three of the paired comparisons.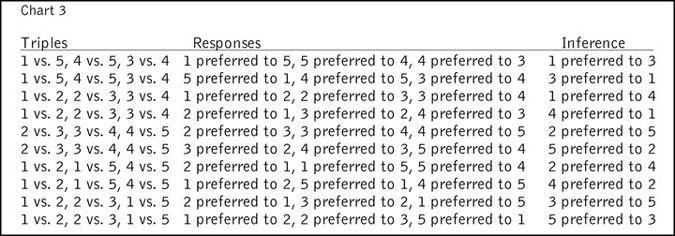
Of course one can only make indirect inferences about what the respondent would have done on the 1 vs. 3 pairing from only a subset of responses to the five pairings in the daisy chain (e.g., from the responses to the 1 vs. 2 and 2 vs. 3 pairings or from the responses to the 1 vs. 4, 4 vs. 5, and 3 vs. 4 pairings, if they are as given above). In some cases one cannot make any logical inference about the results of 1 vs. 3 (e.g., from a respondent who says that 2 is preferred to 1 and 2 is preferred to 3).
Chart 4 shows the results of applying the kind of logic described above to infer what the results would have been in the five pairs that were not part of the daisy chain.
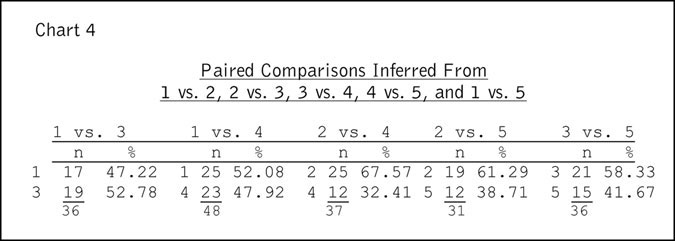
Note that the number of inferences on the pairs not directly compared is less than 50 percent of the respondents. Note also that the inferred percentages are contrary to those based on the full set of rankings. For example, in the case of 2 vs. 5, Item 2 was ahead of Item 5 in 61.29 percent of the inferences, whereas in reality only 48 percent of the sample prefer Item 2 to Item 5.
Which is most and least preferred
The underlying idea in this mode of questioning is that one presents a subset of the items to the respondent and, instead of asking the respondent to rank the items, the respondent is asked to tell the interviewer which is the most preferred and least preferred of these items. In our example of five items, it is a trivial feat to infer the relationship between all the items if the subset is of size three. So let’s consider the case where we present the respondent a subset of four items. There are five possible subsets that may be presented: 1234, 1235, 1245, 1345 and 2345. One can infer from the responses that each of the items not designated as either best or worst is ranked lower than the best and higher than the worst. For example, from the best/worst responses to the 1234 subset we can make the inferences shown in Chart 5.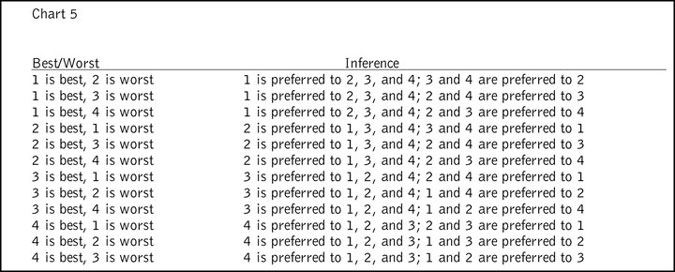
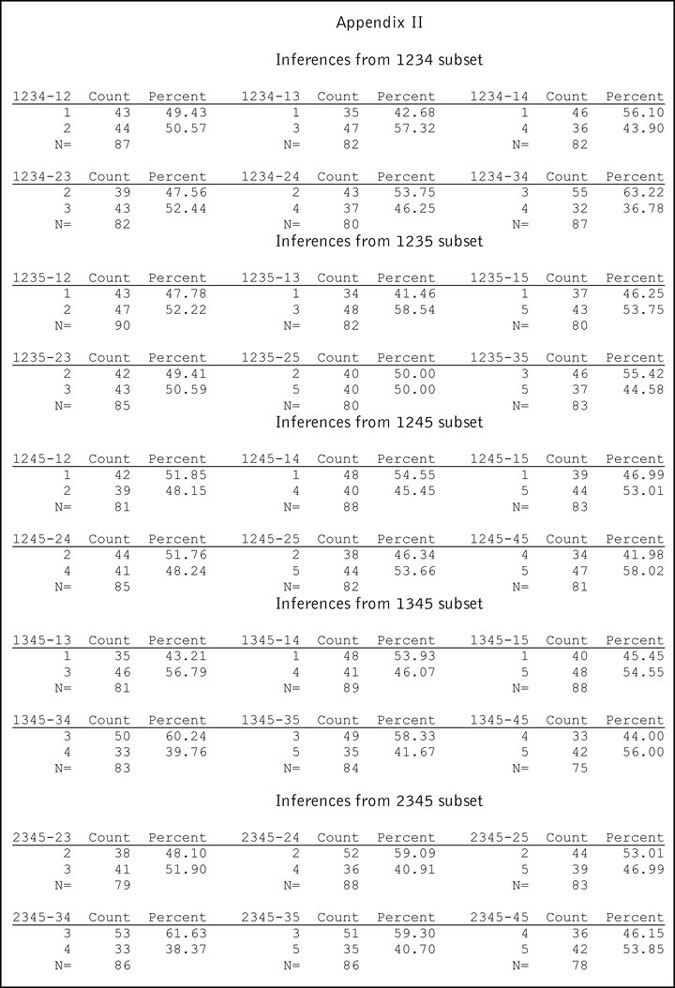
And one can make up similar tables of inferences from the best/worst designations in each of the other subsets 1235, 1245, 1345 and 2345. Appendix II (see below) lists for our example the inferences about pairs of items that can be made from the best/worst designation from each of these five subsets.
Appendix II illustrates that somewhere between 75 to 90 of the 100 respondents’ data are used in estimating the proportion of respondents who preferred Item A to Item B. Moreover, there is no fixed relationship between the estimates made using this method and the estimates made from the rankings themselves. For example, though Item 3 is preferred to Item 5 in 56 percent of the responses, the inference from the 1235 subset is 55.52 percent, and it is 58.33 percent from the 1345 subset and 59.30 percent from the 2345 subset.
No inferences can be made about the item missing from the subset. If one presented the respondent with all five subsets, one could net out the inferences from each of the five and produce the estimates made from the rankings themselves. But what if one only presents a few of the subsets? We consider one reasonable example, namely the presentation of the 1234, 1235 and 2345 subsets. Since all the subsets involving Items 2 and 3 are represented, the net inference from presentation of these three subsets will produce the fraction corresponding to the result of the 100 paired comparisons of Items 2 and 3. But what about the other nine pairs? Chart 6 shows the results.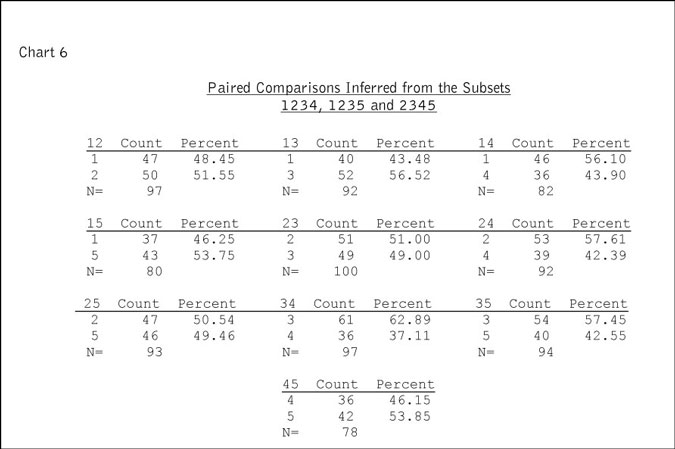
Again, there is no fixed relationship between the estimates made using this method and the estimates made from the rankings themselves. For example, though Item 2 is preferred to Item 5 in 48 percent of the responses, the inference from the net of these three subset is 50.54 percent.
Chart 7 is a recap of the results of our example, where the columns labeled “pct” give the percent of the sample who preferred the first of the pair of items. So, for example, in the 25 line we see that 48 percent of the sample of 100 preferred Item 2 to Item 5, whereas in the paired comparisons daisy chain sample we could only infer preference between these items from 31 respondents and of those 61.29 percent preferred Item 2 to Item 5 and in the four maximum difference sets-of-four we could infer preference between these items from 93 of the respondents and of those 50.54 percent preferred Item 2 to Item 5.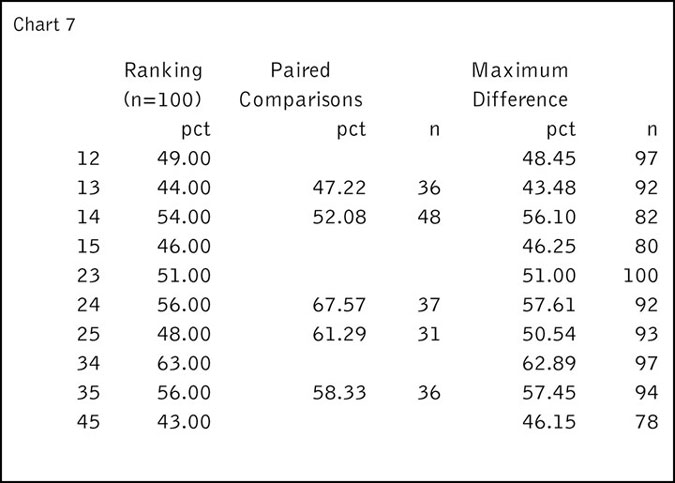
The paired comparisons daisy chain design leads to small n on which to base inferences about the unpaired sets of items. The maximum difference can, with only three iterations, produce a larger n, but not necessarily pick the winner (as illustrated by the 2 vs. 5 inference). Moreover, in both designs one does not know in advance what the sample size will be for any of the comparisons that are not explicitly part of the design. And, as stated earlier, neither of these sets of percentages are unbiased estimates of the proportion in the population that prefer the first of the paired items.
All of this is of course based on the assumption that the respondent is logical, in that if he/she says that Item 1 is preferred to Item 2 and Item 2 is preferred to Item 3 then the respondent prefers Item 1 to Item 3. But, as is often discussed in the psychological literature, this may not be the case.
A simple example is the following. Suppose a respondent is presented with and asked in a paired comparison study to compare three pizzas:
Pizza 1: salami and onions
Pizza 2: pepperoni and garlic
Pizza 3: anchovies and mushrooms
His response to the 1 vs. 2 comparison is, “I prefer Pizza 1 to Pizza 2.” His response to the 2 vs. 3 comparison is, “I prefer Pizza 2 to Pizza 3.” His response to the 1 vs. 3 comparison is “I prefer Pizza 3 to Pizza 1.”
Here’s the rationalization for this intransitive set of responses. The respondent likes onions much more than garlic and garlic much more than mushrooms. Also, the respondent likes anchovies a little better than pepperoni and pepperoni a little better than salami and likes anchovies a lot better than salami. Suppose finally that the respondent makes his choice by first comparing the primary toppings, and, if there is little difference between the primary toppings, uses his preference on the secondary topping as the decider.
When Pizza 1 is compared to Pizza 2 the respondent says, “I like pepperoni a little better than salami but not enough to decide on Pizza 2 on that basis. Since I like onions a lot better than I like garlic, I’ll choose Pizza 1.”
When Pizza 2 is compared to Pizza 3, the respondent says, “I like anchovies a little better than pepperoni but not enough to decide on Pizza 3 on that basis. Since I like garlic a lot better than I like mushrooms, I’ll choose Pizza 2.”
Finally, when Pizza 1 is compared to Pizza 3, the respondent says, “I like anchovies way better than salami, so regardless of the secondary topping, I’ll choose Pizza 3.”
Also, it is well-known that the addition of an element in the set of alternatives may change the rankings of the prior elements. For example, if asked, “Which would you order in this restaurant, chicken or steak?” one might reply “Steak.” But if asked “Which would you order in this restaurant, chicken, steak or fish?” one might reply “Chicken.”
Here’s the rationalization for such a response. When faced with the choice of only chicken or fish in a restaurant one might reason, “I prefer chicken but chicken is more difficult to prepare than steak, so to be on the safe side I’ll choose steak.”
Now, when faced with the choice of chicken, steak or fish, one might reason, “Fish is even more difficult to prepare than chicken. Since fish is on the menu, this is a signal that there’s a good chef here, so I’ll now order the chicken.” So even explicit responses in a maximum difference mode will not be consistent with the responses in a paired comparison.
Not an easy substitute
The bottom line is that, though it may be easier to implement multiple paired comparisons and/or maximum difference subsets, one should recognize that they are not an easy substitute for the traditional rankings.
Footnotes
1 Sometimes the ranking task is bypassed by asking the respondent to rate a large number of items, with the rankings inferred from the ratings. There are many additional issues that can be raised when this manner of obtaining rankings is used, due to problems associated with administering ranking questions in various interviewing modes, problems associated with the validity of the rating scale that is being used and to the problems associated with converting from ratings to rankings. We do not discuss these issues in this article.
2 Only the use of subsets of sets of items in a maximum difference interrogation or of pairs of items in a paired comparisons setting to estimate preference proportions is considered in this article. We do not consider herein any other uses of these survey frameworks, such as for estimation of utilities in a conjoint setting.