What caught their eye?
Editor's note: Cathleen Zapata is vice president of research and customer experience at Metrics Marketing Group, a Cleveland database and interactive marketing firm.
In order to maximize your return on investment when it comes to direct mail, it’s essential to understand and to take into account the actual recipient experience. With the high amount of mail consumers receive each week, there’s little opportunity to grab attention and stand out from the crowd. With consumers’ limited time and attention spans, this makes focusing on the complete mailbox experience even more imperative, analyzing not just your competitors’ pieces but all the pieces your consumer may receive at once that are vying for their attention.
Recipient experience testing is the validation of a design by observing how real users interact with it. It involves recruitment of qualified participants and testing them one at a time in a lab environment or in the field. It’s used primarily to learn how your customers react to a print piece, understand what they see (or don’t see), for how long and when, to observe their emotional response and to hear their comments as they interact.
Additional insights often include:
-
Why are my prospects throwing my mail piece away?
-
What messaging will best motivate them to take action?
-
What creative will best ensure my mail piece gets noticed and my messages are coming across?
-
How does one design concept compare to another?
-
How do I stack up against the competition?
There are many different types of mail-recipient experience testing that can be done based on business goals and key insights looking to obtain. Last year, the research and customer experience team of Metrics Marketing conducted a proprietary recipient experience study with eye-tracking involving 45 different mail pieces across 33 different companies. A variety of industries and package types were included. The primary goal of this study was to gain preliminary insights into how long mail recipients view and interact with a direct mail piece before they make the critical decision of keeping it (to share with someone else in the household or for later reference or usage) or throw it away. Additional behavioral insights on how recipients view and interact with advertisements received in the mail were also obtained.
Asked to imagine
A mix of 18 participants were tested at MetricsLab in Cleveland. Participants included nine male and nine female direct mail recipients, median age 35, with a variety of interests, needs and experiences. Each participant was tested one at a time and asked to imagine they just came home from work and had to sort through their mail. Upon doing this: participants’ eyes were tracked as they reviewed each piece of direct mail presented; the time it took for each participant to naturally finish reviewing each piece was logged; and participants decided if they would “keep” or “toss” each mail piece after review.
Results were analyzed amongst hundreds of output points and compiled into a report, including heat map, focus map and key performance indicator (KPI) maps for every direct mail piece tested.
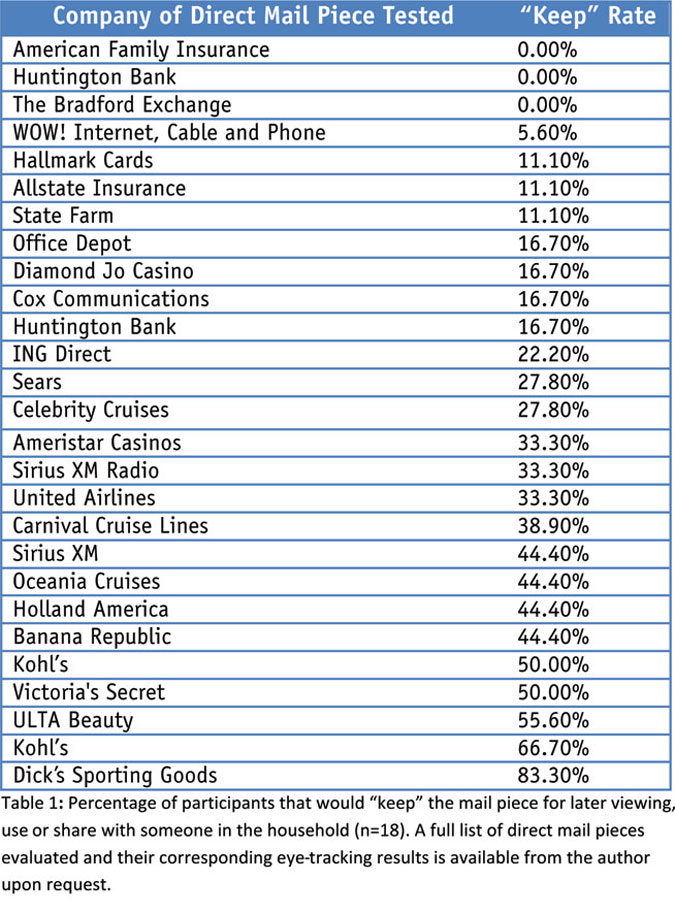
Overall, participants kept 26 percent of the mail pieces tested to review further or share with someone in the household. In addition, the median time participants spent reviewing each piece was about eight seconds. This is what they based their decision on when deciding to keep or toss each piece.
Table 1 demonstrates sample results of which direct mail pieces participants indicated they would keep for later viewing, use or share with someone in the household and which ones they would toss.

Of all 18 participants tested, several direct mail pieces had a 0 percent keep rate, meaning no recipients indicated they would keep those pieces. At the other end of the spectrum, the direct mail piece for Dick’s Sporting Goods had the highest keep rate, with 83.3 percent of participants indicating they would keep it for later or share with someone in the household.
Precisely measure
Eye tracking is used to precisely measure what someone is looking at. An infrared light is directed into the eye. The light enters the retina and is reflected back to a camera. The vector between the center of the pupil and the corneal reflection is measured and point-of-regard is found. Using trigonometry, the system calculates eye movements.
In addition to eye gaze, heat maps are amongst one of the most common outputs to evaluate what users see. Heat maps highlight areas that users see most often. Areas viewed more often are darker in color (shown in red) than areas viewed less often (yellow). Areas without color were not directly viewed. Focus maps are similar to heat maps but show areas viewed less often in black. Areas that are clear were directly viewed more often.
The chart of key performance indicators displays statistics for identified areas of interest. The sequence of one area of interest is the order that area was viewed, taking into account all identified areas. Areas that are not designated as an area of interest are described as white space. The dwell time is the number of microseconds that users looked at the specific area of interest. The percentage next to the dwell time tells what percentage of the overall viewing time was spent on this item. The hit ratio describes the number of users who focused on that area of interest, out of the total number of users included in the analysis. Numerous additional eye-tracking measurements are also often used based on the particular goals of the study.
Provided specific insights
In this instance, the eye-tracking outputs for each direct mail piece tested provided specific insights on what participants viewed (and what they didn’t), in what order and for how long, for each piece. For example, in the direct mail piece tested for Allstate Insurance (Figure 1) recipients first looked at the access quote card and initially spent the majority of their attention on this area. From there, the top of the piece drew their attention next but their focus remained on the messaging vs. the annual savings amount, which was anticipated to receive higher views.
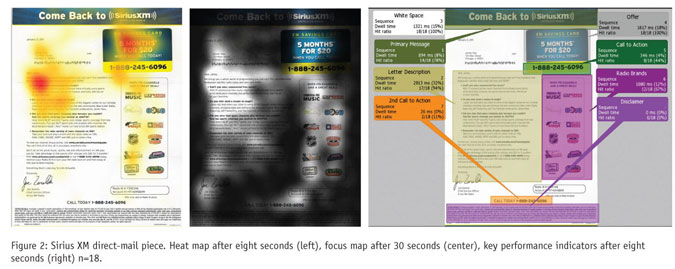
In another example of a Sirius XM piece tested (Figure 2), results showed that recipients were first drawn to the “Come Back” messaging at the top of the page, although minimal time was spent in this area.
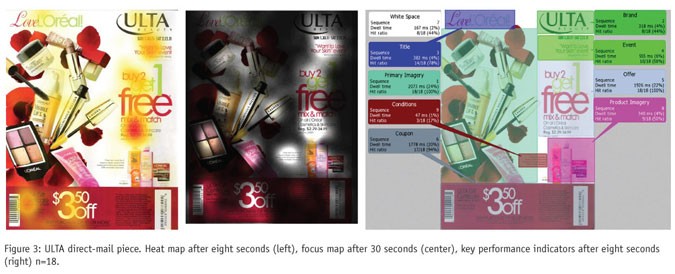
Lastly, as seen in Figure 3 for the sample piece tested for ULTA Beauty, all recipients saw the primary offer on the right side of the piece, spending 22 percent of their total time in this area. All but one recipient saw the coupon, with recipients spending 20 percent of their total time in this area. Less than half of recipients viewed the ULTA logo upon initial review.
Across the eye-tracking data analyzed amongst all of the pieces tested, several overarching trends emerged, including:
-
Color had no significant affect on the amount of time recipients spent viewing the piece.
-
Female participants viewed each mail piece slightly longer than males, at an average of 10.5 seconds per piece.
-
Pieces with a coupon included had a keep rate 2.5 times higher than pieces without one.
-
The average keep rate of brochures evaluated was 2.5 times higher than letter pieces evaluated.
-
Lastly, pieces with faces looking towards the primary call to action resulted in higher view time on the call to action and less time looking at the face(s) (vs. pieces with faces looking head on).
Optimizing the creative
For direct mail, the print cycle is long and competition is fierce, thus optimizing the creative prior to launch is imperative. Eye-tracking provides marketers with real data to optimize their direct mail campaigns and ultimately improve conversions. If the recipient isn’t intrigued enough upon first impressions to engage with the piece in the first place – or if they don’t even have the opportunity to see the offer and call-to-action with the minimal time they are willing to spend – then the foundation for success is missing. Eye-tracking can help uncover major opportunities to better understand the recipient’s behavior and, ultimately, aid in campaign success.