Rules of engagement
Editor's note: Steve Gittelman is president, and Elaine Trimarchi is executive vice president, of Sample Solutions, an East Islip, N.Y., research firm.
When those of us who conduct online research are confronted by poorly-engaged respondents, we face a conundrum. How should we react? Which respondents should be kept in the data set and which must be removed? In the absence of clear rules and guidelines or salient tests, perfectly acceptable respondents could be removed and the data that we hold so sacred could be placed at risk.
Clients need to know that the changes they see in their data are real and not due to changes in the underlying sample frame. Gone are the days when a probabilistic sample frame governed our research. Instead, we are in a relatively new era of “convenience” sampling – and are finding it anything but convenient.
We advocate proper treatment of respondents in all respects. Our surveys are at times long, boring, convoluted or on esoteric subjects. Respondents are enticed with robust incentives and sent packing with lotteries. We screen them in a neverending sequence of questions until we can fit them to our purposes. Sadly, we get what we encourage.
Some respondents satisfice their way through surveys. They provide us with little or no attention to the questions that we offer them and instead “complete” the task with less attention than is required. In the end, we must establish rules for the elimination of respondents whose efforts, or lack thereof, are not fit for our purposes.
As researchers, we must understand the potential impact of poorly-engaged respondents on our work and take appropriate action but there exists no guideline for making such decisions. In our previous Quirk’s article (“Your results may vary,” November 2012) we provided an exhaustive overview of global online panels and the degree to which they had demonstrated consistent results in a multiwave tracking study. Those that did not prove consistent appeared to have high levels of poorly-engaged respondents.
From these data we ask the following questions:
Is there a relationship between respondent engagement and the ability of online panels to be consistent?
Are poorly-engaged respondents answering in a random fashion or do they instead demonstrate a directional pattern?
Does engagement have a bearing on the data collected? Are those differences significant? Is the difference in data meaningful to the point of changing our understanding of the data we have collected?
Increasing in use
Metrics for calibrating engagement levels have been increasing in use during the past five years. One particularly elegant proposal came from Garland (2012), an outlier detection system. Our QMetrics took its early form (Gittelman and Trimarchi, 2009) from a paper presented at CASRO (Courtright, M. and D. Brien, 2009). With some changes, we adopted this QMetrics score to fit the test instrument that we have deployed in 35 countries where we audited over 300 online panels as part of the Grand Mean Project. Respondents were subjected to two consistency questions, one trap question and an analysis of speeding and straightlining (also known as non-differentiation) as a part of the QMetrics scale we deployed for this study. We quota-controlled demographically-balanced samples among the 20 panels willing to participate in the process from 2008 to the present as they conducted repeated waves of a tracking study.
Our questionnaire is a diagnostic tool intended to measure three types of respondent behavior, questionnaire execution and the frequency of panel membership/survey-taking. In addition, a battery of 10 largely behavioral segmentations relating to purchasing behavior, psychographics and media as well as seven market segments are derived from the 17-minute survey instrument. We track speeding and have built in grids to detect non-differentiation of response – more commonly known as straightlining (Gittelman and Trimarchi, 2012).
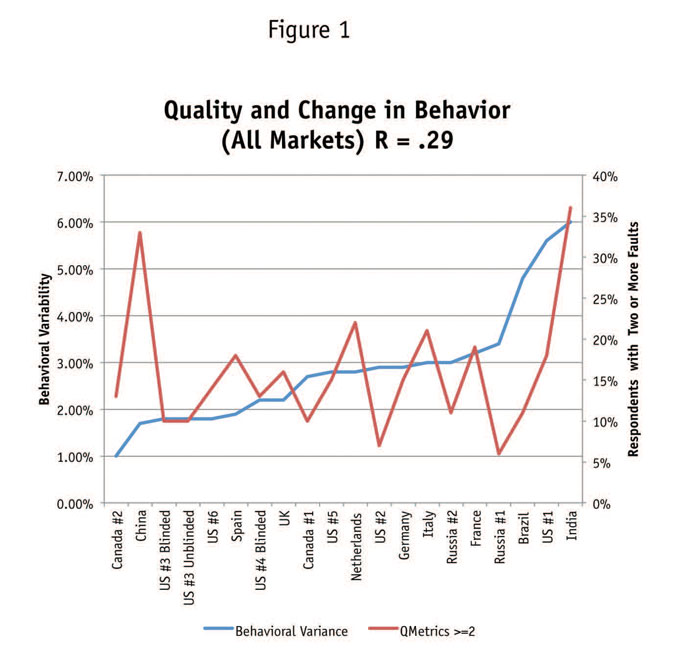
Panels that tracked consistently tended to have low percentages of poorly-engaged respondents. Those that struggled to be consistent had greater numbers of respondents who had high QMetrics scores. We found that there exists a correlation (R = 0.29) between the ability of a panel to be consistent and the frequency of poorly-engaged respondents (Figures 1 and 2).

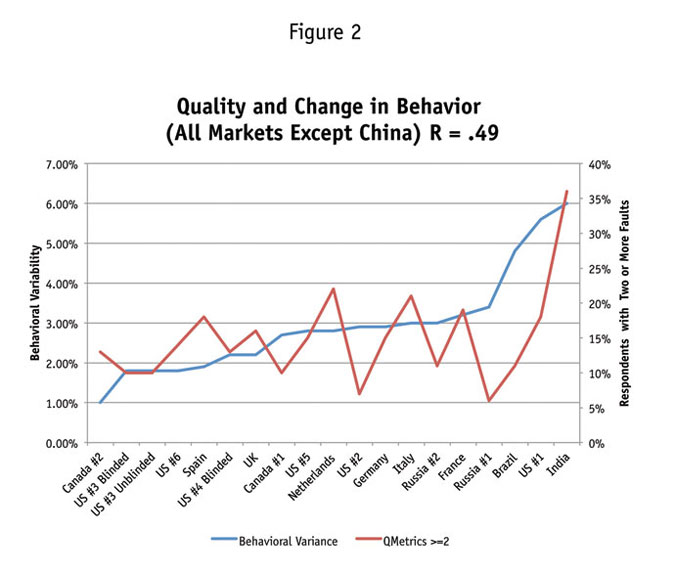
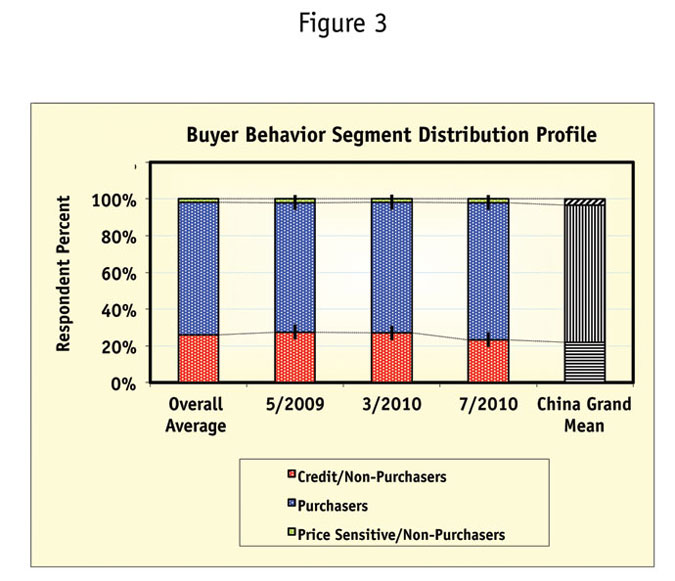
China represents an outlying case, which we have nicknamed “China Syndrome.” Engagement levels were very poor, with some 40 percent of respondents falling into the top-two bar threshold of QMetrics. The range of behaviors being represented was small, with those fitting the “Price Sensitive” segment essentially non-existent. If the data were to be accepted in its raw form, the implication would be profound. An advertising campaign using this data would ignore price as a consideration. We find this to be an absurd conclusion drawn from a sample frame overwhelmed by poorly-engaged respondents who fell out of the other segments including purchasing and purchasing without a credit card (Figure 3).
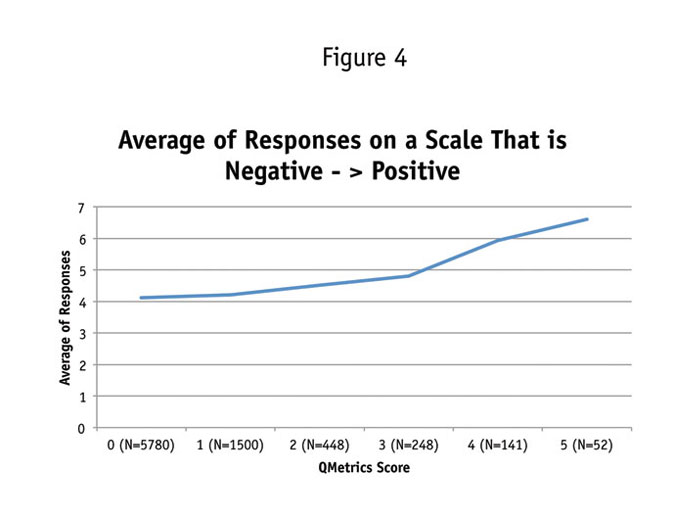
How do the poorly-engaged bias data responses? Let’s look at an example. Our questionnaire contained two grids. One focused on the online habits of the respondents and a second on a battery of psychographic questions. These psychographic questions, generally used in our sociographic/psychographic segmentation, showed one increased in agreement from left to right and the other in reverse.
In a sample of 8,169 respondents drawn from American panels, participating in the Grand Mean Project, there was a predilection for respondents to answer in the positive even if the scales on two separate grids were flipped. One grid consisted of a seven-point scale with a positive answer appearing to the right (Figure 4) and in the second grid a five-point scale where a positive response was indicated to the left (Figure 5). As the QMetrics score increases so does the predilection to answer in the positive. Respondents appear sufficiently engaged to read the change in direction of the scale but are answering in a non-random directional pattern.
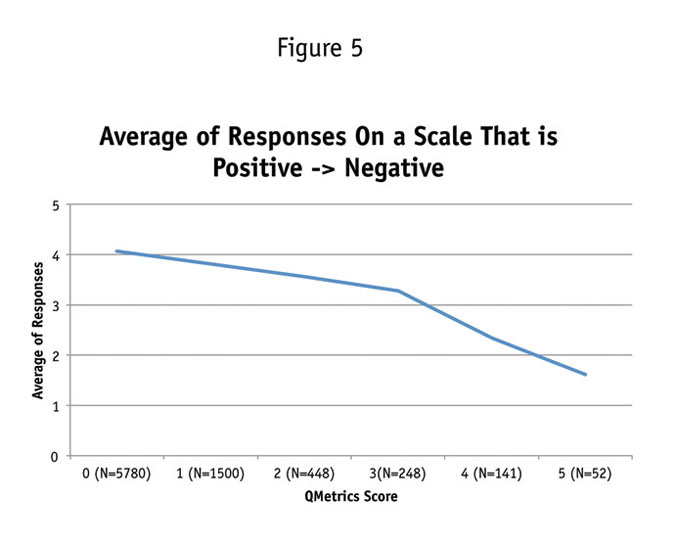
The predilection to answer in the positive can have meaningful effects. In our case it reduced the magnitude of the price-sensitive segment and increased the purchasing segment. This can sorely influence how we interpret the results and rise to a fundamental problem in data analysis.
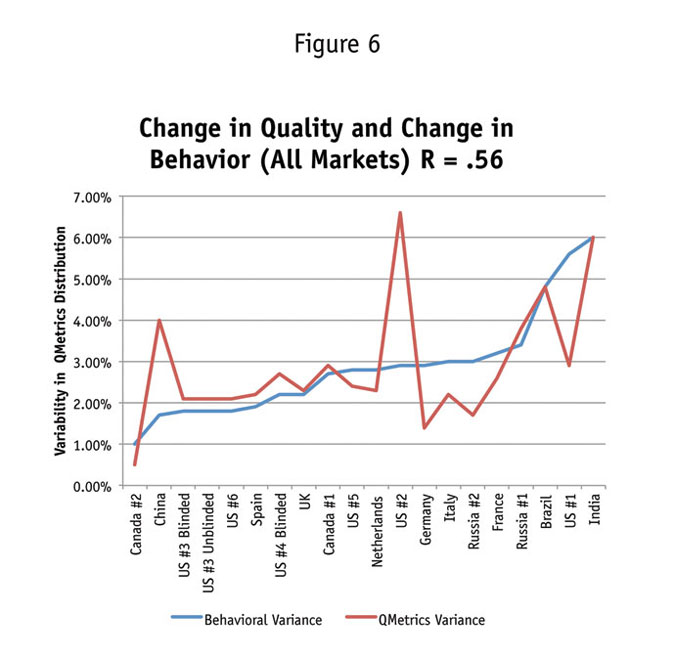
Further, those panels that suffer from unstable numbers of unengaged respondents exhibit variability in the behavioral segmentations we tracked. This coupling of variability in the numbers of engaged respondents and variability of the behaviors we measure (Figure 6) speaks highly to the need for stabilization of the number of respondents who are in fact unengaged. The argument for minimizing their number is also evident as it follows that their impact is diminished as their dominance is lessened.
Strategic removal of poorly-engaged respondents provides a partial solution for data bias. If the most poorly-engaged respondents are removed, some data “correction” occurs (see Figure 7). In this case, restoration of the purchasing segment and reappearance of the Price Sensitive segment begins to become evident. Poorly-engaged respondents, in a fashion reminiscent of China, claim to have minimal price sensitivity, a situation which is altered on the removal of those respondents.
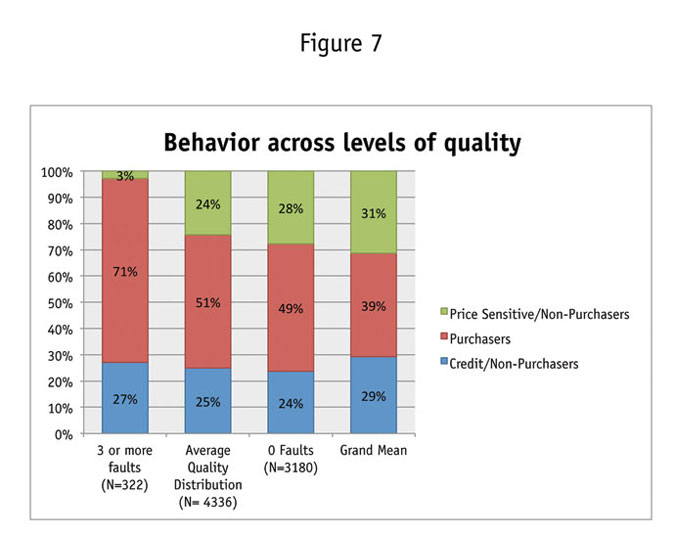
We may now have an answer to what we earlier called the China Syndrome. If the Chinese respondents are poorly-engaged, then it is possible that they have provided biased data similar to that indicated in Figure 7, where the price-sensitive segment essentially disappears among the poorly-engaged American respondents.
The bias created by poorly-engaged respondents is often sufficient to influence decisions that we might draw during analysis. It is essential to consider proper action to deal with these respondents. Preferably, our protocol is conducted in real time so that the replacement of respondents as a process can be dealt with during study execution.
One of the most frequent objections we receive in applying any quality protocol is the preference to leave a client-approved questionnaire untouched. Our preference would be to provide input to allow the creation of a proven QMetrics battery of questions. We hope to have at least five measures deployed in the questionnaire. In four-out-of-five surveys, we are able to find four or more QMetric-type questions, a sufficient number to create a quality scale of adequate depth.
No respondent be removed
Industry practice appears to include the removal of a small percentage of the most heinous offenders. We advocate that no respondent be removed unless there is an indication that the data they provide is atypical and/or logically inconsistent. Once we have confirmed that we have respondents who score high on the QMetrics scale, indicating atypical survey-taking behavior, we then compare data on different levels of QMetrics to the growing study data file to compare respondents falling at different quality tiers along the scale. We look at an array of questions within the questionnaire that are likely to be important to the future analysis. If that fails to detect difference, we keep digging. If key questions show no difference but lesser questions do, our determination becomes more subjective.
The removal of respondents from a data set can drive other forms of error. We usually use what we believe to be a meaningful difference criteria, rarely relying only on statistical significance, often looking at a shift of 20 percent or more from the average for zero faults (a well-engaged respondent). If the data is different, we tag the respondents for future removal, always planning to revisit these same respondents to confirm that the relationships we first identified remain as additional data is collected. We keep digging, comparing data from the highly-engaged to their less-involved colleagues. As the study evolves, we amount significant evidence to support the removal or retention of each QMetrics tier.
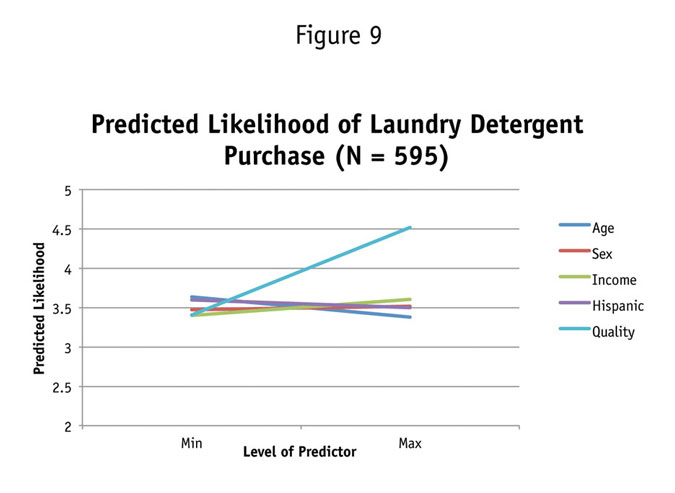
Not all studies track the consistency of online panels around the globe. Most treat subjects considerably closer to home. As an example of a project we treated through a combination of QMetrics and data bias, we offer one on laundry detergent. In our laundry detergent study we were able to create a six-item QMetrics scale and rank respondents by zero to six to faults. The questionnaire did not require the addition of questions to create the metric; we were able to naturally identify good candidates. One seminal question was, “How likely are you to buy any of these detergents?” a fundamental and core question for the vertical. Using respondents with zero faults we could measure the impact of decreasing quality as respondents with no faults were compared to those with one to six (Figure 8).
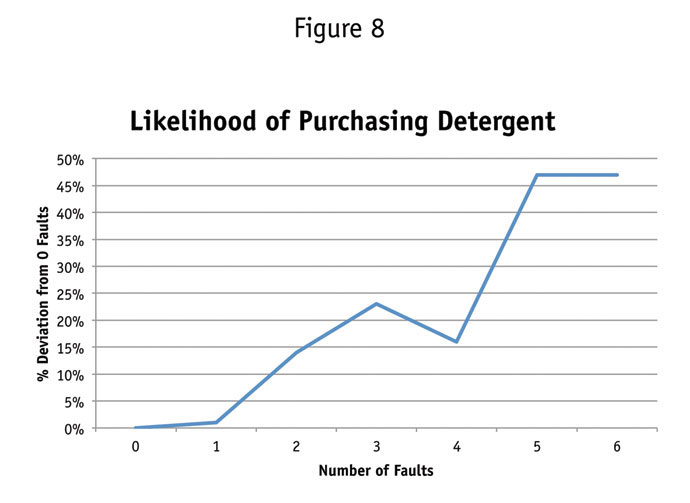
Age, sex, income and race all had less influence on the likelihood of laundry detergent purchase than did the quality (engagement) of a respondent. It is not an outcome that is often part of the report given to a client (Figure 9).
Battery of reference points
In an ideal world, every online study would include a battery of reference points against which we could calibrate the accuracy of responses provided by respondents. We carefully craft our QMetrics scores but prefer that they not be used in a vacuum. Instead, we strongly suggest that quality outside references be imbedded in questionnaires to help calibrate the metrics themselves. Here we give four examples.
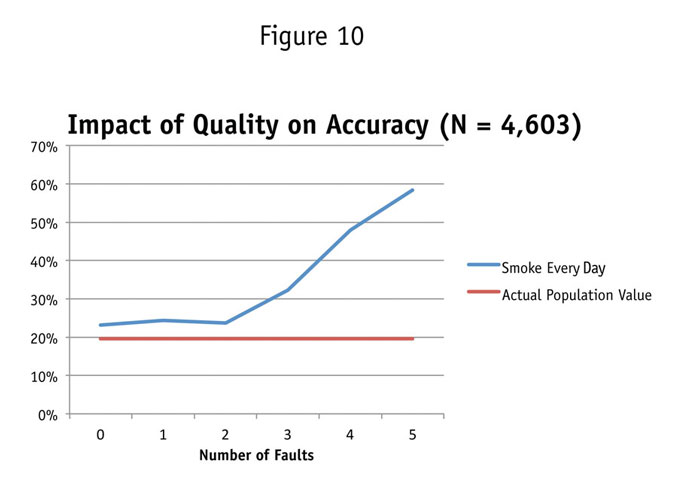
Smoking a cigarette every day is a commonly-used reference point. Data on the subject can be obtained readily from government agencies such as the CDC for this and other health-related points. A simple question in a questionnaire could help determine which QMetrics segments should be kept in a data set and those that should be eliminated. We can consider for elimination those QMetrics segments that cause us to suspect the quality of their responses by providing data different from the outside reference being deployed. American respondents drawn from our consistency research who had three or more quality faults claimed to smoke far more than would be expected (Figure 10). Respondents with three faults and above would be eliminated from this sample set.
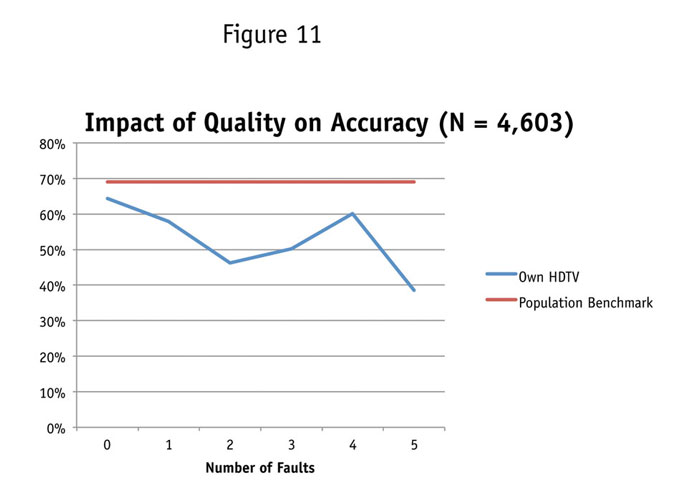
It is not always possible to include a question on smoking. Often the subject matter of the targeted study does not lend itself to the question. In Figure 11 we provide an example of where we used ownership of a high-definition television set as a discriminating question. The data is not quite as demonstrative as the smoking data.
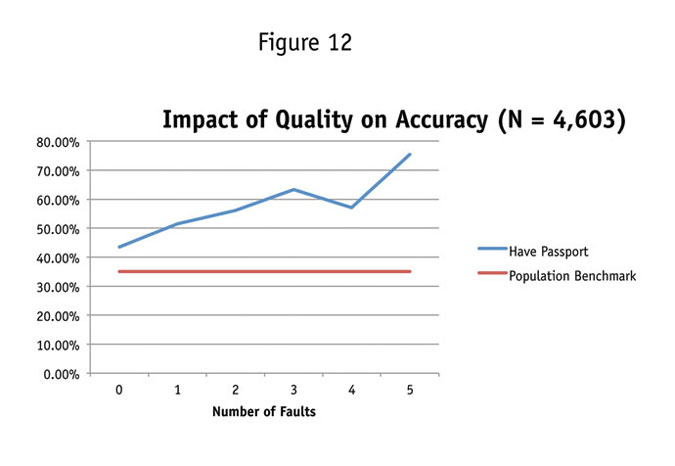
Those bearing a passport are well documented by the federal government, thus making passport ownership a reasonable reference point. We find that respondents who are poorly engaged tend to report higher than normal passport ownership. Here, respondents with three faults and above would be considered for elimination (Figure 12).
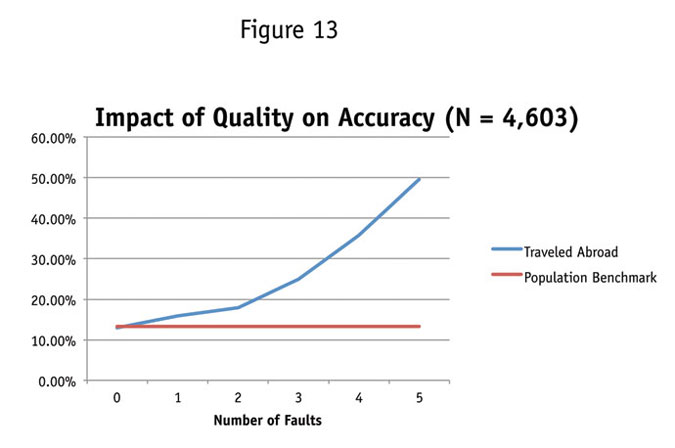
At times, it can be argued that we should expect some types of respondents to be poorly-engaged. Travelers might be thought to fall into that category. Time restraints of travelers might make them less patient with long surveys. At times we find that those with three or more faults indicate such high levels of travel that it is sufficient for us to discount the data they provide (Figure 13).
A crisis within the crisis
There is a crisis within the crisis. We are most often forced to compare data within a questionnaire and are rarely afforded the luxury of comparisons to outside reference points. In that case, the data collected tends to float without connection to the real world. We tend to have little sense for the accuracy of the data we collect and must then rely on data consistency as a logical fallback. The reference points themselves are often collected by other means of data collection (face-to-face, mail, telephone, etc.), may suffer from modal differences and may be a bit old in a fast-changing world.
To meet our own needs for reference points, we conduct the Grand Mean Project, a yearly multimode study which provides us with a rich source of reference material to compare current data from any study we might perform. By imbedding questions into a survey, we can conduct the kinds of tests that we believe are needed when calibrating the work of others or testing our own research.
In our introduction we referred to an absence of clear guidelines or salient tests for dealing with poorly-engaged respondents. We offer the following thoughts:
-
Create and deploy a test of engagement (such as QMetrics) on every study.
-
Poorly-engaged respondents can disrupt consistency as well as change data both in a statistically-significant and meaningful fashion.
-
Quality metrics (QMetrics) that we create have an arbitrary nature to them and should not be deployed alone. Respondents that appear unengaged should be eliminated. In this case we have argued that before we winnow out respondents as good or bad we must find them to score highly on the QMetrics scale and offer some evidence that the data they provide is different from peers for whom we have no quality concerns.
-
QMetrics scales should be grounded in questions that are found in the questionnaire or those that we craft ourselves – with the permission of the client, always.
-
Finally, by using external reference points taken from independent outside sources, we can ground our research by educating us about the relative accuracy of our efforts.
References
Courtright, M., Brien D., and Marjette Stark. “The devil is in the data.” DMS white paper. February 2009.
Garland, Philip. 2012. “Speed doesn’t kill: a new way to detect survey satisficing.” CASRO Online Research Conference.
Gittelman, Steven and Elaine Trimarchi. “QMetrics – a new online quality standard.” White paper. Mktg, Inc. 2009.
Gittelman and Trimarchi. 2012. “Consistency in global non-probabilistic online samples.” CASRO Online Research Conference.