Apples to apples to apples
Editor's note: George Terhanian is president, North America and group strategy officer at Toluna, a Wilton, Conn., research firm.
Critics of online research tend to focus on sample representativeness. In 1999, for instance, Warren Mitofsky maintained that no matter how researchers adjust the results of a survey among respondents selected by any means other than probability sampling, they would be unable to correct for the biases that arise from the difference between the sample and the population of interest. As he put it, “the willingness to discard the use of sampling frames as a means of selecting a sample and then the feeble attempts at manipulating the resulting bias ... undermine the credibility of the survey process” (Mitofsky, 1999, p. 26).
Nine years later, Jon Krosnick contended that there is no theoretical justification by which an opt-in panel of potential survey respondents (selected by means other than probability sampling) can constitute a credible sampling frame for surveys that purport to represent the attitudes, opinions and behaviors of a broader population. According to Krosnick, “to draw a scientific and representative sample of all residents ... it would be necessary to use a procedure that gives every member of that population an equal (or known) probability of being selected to participate in the survey” (Krosnick, 2008, p. 8).
Even more recently, Gary Langer “pilloried online polling, calling their sampling frame ‘a club of people who signed up to take point-and-click surveys for points redeemable for cash and gifts’” (Shepard, 2012). Like Mitofsky and Krosnick, Langer believes that “non-probability samples lack the theoretical underpinning on which valid and reliable survey research is based” (Langer, 2009).
Despite these criticisms, the growth of online research during these years has been nothing short of astonishing, driven heavily by research buyers with a deep interest in transitioning tracking surveys from telephone data collection to online in order to reduce costs. Unfortunately, some of these buyers have been burned badly for the very reason cited by Mitofsky, Krosnick and Langer: the failure to ensure that the characteristics of the sample they selected was consistently representative of the target population from wave to wave. And the evidence suggests that these difficulties may be increasing rather than decreasing.
Does a solution exist? If so, to whom might we turn to identify it? How about a 12-year-old boy who wants to make the best possible apple juice for his mom and dad?
When my nephew Ryan came to New York to visit me last July, we decided to try out the juice-making machine that Ryan and his sister Jordan had given me for my birthday in December. Because there was no fruit in my apartment, we set out for the nearest supermarket, the Food Emporium.
Ryan had his heart set on apple juice but was unimpressed with the slim selection. After examining more than 50 apples, he was able to find three perfectly round ones that appealed to him. We then headed north to Trader Joe’s, where Ryan found only two yellow apples to his liking. So we walked a few blocks farther north to the Fairway, where Ryan was again underwhelmed. This time he picked just three red ones so we were still two short of our goal of 10.
Discouraged, we headed for home, pinning our hopes on the fruit vendor on 67th and Broadway. I had bought nothing from him in three years. To our surprise, we found two apples – one small, one large – that passed muster.
Transforming the apples into juice proved easy. A few noisy minutes later, we had enough delicious juice to last a couple of days. By the time Ryan’s parents arrived to retrieve him on Sunday, though, none was left. Ryan had called, texted and e-mailed about the amazing juice, so to give his parents a taste he asked me to accompany him on a second apple quest.
As we had done before, we began at the Food Emporium. This time, not one apple met Ryan’s standards. We did better at Trader Joe’s, leaving with three green ones. Fairway had something to offer too: four red apples that Ryan found a perfect match to those he had selected the first time. Still three short of our goal, we walked back down Broadway to visit the fruit vendor across from my building, but he was nowhere to be found. So we walked another eight blocks to Whole Foods and found three small yellow apples, reaching our target of 10.
When his mother finally tasted the perfect juice, she asked Ryan how he had selected his apples. Ryan cited the apples’ color, size, shape, feel, firmness and price. He said he processed all of those qualities simultaneously each time he chose an apple. Although he scrutinized more apples on Sunday than on Wednesday, he did not seem to mind. He wanted to get it right.
Ryan’s approach was to select an optimal sample of apples to act as a baseline, against which apples from any number of other stores could be compared to make sure their characteristics match the base.
Meets a predetermined standard
Selecting nearly identical apples on multiple occasions is analogous to selecting nearly identical respondents for multiple waves of an online tracking survey – the kind that attempts to measure change over time. In both cases, the key lies in examining each apple, or each respondent, thoroughly at the time of selection to ensure it meets a predetermined standard. Other possible methods for ensuring a match, such as buying from one go-to store or relying on respondents from one trustworthy source, are prone to failure.
If Ryan and I had shopped only at the Food Emporium on both days, for instance, we could easily have taken 10 apples home each time but they would have been inferior to the ones we purchased. Likewise, if we had attempted to buy the same number of apples from the same stores on Sunday as on Wednesday, we would have gone home with a bagful of lower-quality apples. The fact that the fruit vendor was missing on Sunday would have made the task impossible anyway.
Market researchers who commission or run tracking studies tend to make different assumptions from those Ryan made. Many assume that the characteristics of respondents who originate from each sample source they use do not change over time. That would be akin to Ryan assuming that the characteristics of the apples from any one store are the same over time.
Other researchers rely on respondent-selection methods, such as quota sampling based on individual characteristics such as age, gender, and region, that fail to encompass respondents’ key characteristics. (Researchers who rely on quota sampling to select respondents for surveys typically begin by dividing the target population into a set of mutually-exclusive groups before they then specify how many respondents to recruit from each group.) Such quotas may even produce skews (e.g., too many non-working people, too few married people) that affect sample composition as well as the outcomes of interest. The obvious alternative – to add quota variables such as race/ethnicity, income, education level, marital status, employment status, and possibly others – isn’t feasible through conventional approaches, because it requires an enormous number of quota cells. As a result of the assumptions and the associated decisions they make, some researchers – perhaps many – end up mistaking sample composition changes for changes in what they are trying to measure. That mistake defeats the purpose of running a tracking survey in the first place and wastes time and money.
Although Ryan is only 12, he could probably teach those researchers a lesson or two. He would likely suggest that when selecting respondents for tracking surveys, the characteristics of the respondents are of far more importance than the source from which those respondents originate. He might also point out a practical benefit of such a position: It opens the door to interviewing respondents from virtually any source, rather than just a handful of previously vetted ones. Today, no one seems to be offering researchers such advice.
Knew next to nothing
At this point, it may be useful to provide some additional background information. Fifteen years ago, market researchers knew next to nothing about online research. Back then, almost all interviews were completed via telephone, paper-and-pencil or face-to-face. Today, researchers know much more about online research and most interviews (specifically, those commissioned by U.S. market research buyers) are completed online. U.S. spending on online surveys is expected to exceed $1.8 billion in 2012, and European spending to surpass €0.7 billion (Inside Research; 2012a, 2012b).
To keep up with online demand, some market research companies have developed new methods of accessing potential survey respondents, such as river sampling, whereby online users, after clicking through an invitation or advertisement on a Web site, are directed to a survey for which they might qualify. Some companies have introduced routing systems, as well. Among other capabilities, such systems direct individuals who do not qualify for one survey to take another, which can increase overall capacity.
Despite these advances, researchers often find it difficult to complete the needed number of interviews on time, particularly when the target population is rare or in high demand. Hence there is a need to use more than one sample source for some types of studies, such as tracking surveys.
Unfortunately for researchers who’ve elected to use multiple sources, some evidence suggests that this decision may increase bias. In research conducted in 2008 that explored the quality of survey data from 17 different opt-in panels, for instance, the Advertising Research Foundation found “wide variance, particularly on attitudinal and/or opinion questions (purchase intent, concept reaction, and the like),” even after holding constant socio-demographic and other factors (Walker et al., 2009).
Since that time, some researchers have launched new research to understand how to select multiple sample sources for the same survey. For instance, Mitch Eggers has described the Global Market Insights Pinnacle methodology quite positively at industry conferences (see Eggers, 2011) while Steve Gittelman and Elaine Trimarchi (2009) have made the case for the merits of Mktg. Inc.’s Grand Mean Project at some of those same conferences and elsewhere.
Typically, proponents of the new approaches cite three main benefits: consistency (or interchangeability) of new respondent sources with existing ones; complementariness of new respondent sources with existing ones relative to an external standard; and enhanced representativeness relative to the U.S. general population through calibration with non-online data sources.
In my view, there are, however, at least three downsides to those approaches: they restrict the pool of potential respondents to those from sample sources vetted beforehand, which reduces respondent supply; they assume that the vetted sample sources do not change over time; and they rely on benchmark data sets that have either short shelf lives or uncertain external validity.
Would cringe
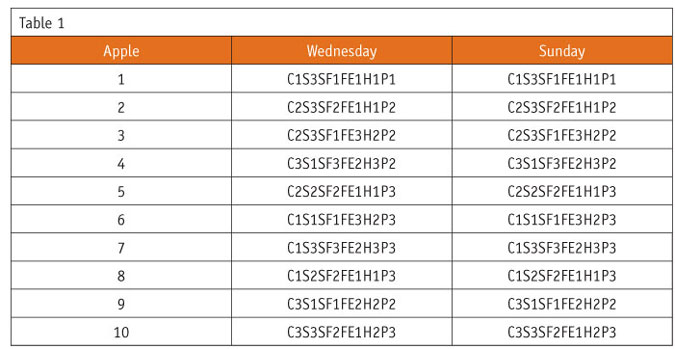
My nephew Ryan would cringe if someone advised him to select apples that way. Such a method would force him to accept artificial limitations (e.g., you can only shop at a handful of previously-approved stores; you cannot spend time scrutinizing each apple) that he would not understand, let alone accept. As you might recall, Ryan explained to his mother that he evaluated each apple’s color, size, shape, feel, firmness and price simultaneously when deciding whether to purchase it. For our purposes here, let’s assume that each of these six attributes has three levels, as described below:
Color (C): (1) Red, (2) Green, (3) Yellow
Size (S): (1) Small, (2) Medium, (3) Large
Shape (SH): (1) Perfectly Round, (2) Imperfectly Round, (3) Other
Feel (FE): (1) Smooth, (2) Somewhat Rough, (3) Very Rough
Firmness (F): (1) Very Hard, (2) Firm, (3) Soft
Price (P): (1) Low, (2) Medium, (3) High
After Ryan selected 10 apples from four stores on Wednesday, he sought 10 apples on Sunday with exactly the same characteristics as Wednesday’s haul. That was easier said than done, given the number of attributes (6) and the number of levels within each attribute (3). There were 729 possible unique combinations (or three to the sixth power). Imagine how daunting a task it would have been if there had been, say, 10 attributes and 5 levels of each. In that case, there would have been 9.7 million possible combinations.
One way to evaluate how similar the apples that Ryan selected on Wednesday were to those he picked on Sunday is through a simple analysis whereby we code the 20 apples, as shown in Table 1, then compare the codes.

An eyeball analysis of the codes suggests that Ryan got it right. Now imagine if he had selected 10,000 apples rather than 10 on each occasion. To say the least, it would have been difficult to assess how close to identical the two samples were by eyeballing them. Fortunately, there are other options. Through logistic regression, we can estimate each apple’s probability (0 to 100 percent) of being in one day’s haul, say Wednesday’s rather than Sunday’s.
We know, moreover, that apples with the same probability, which researchers also refer to as a propensity score, would share the same joint distribution of characteristics – that is, their characteristics would be nearly identical (Rosenbaum and Rubin; 1983, 1984). And if the distribution of propensity scores of Wednesday’s apples was nearly identical to that of Sunday’s, it follows that the apples would be nearly identical as well.
An additional output of the exercise would be a statistical model, which we could then use on each future shopping trip to estimate each new apple’s similarity to a benchmark before selecting it. That would be the best way to ensure near-identicalness from shopping trip to shopping trip – or, in the case of a tracking survey, wave to wave. The approach would also obviate the need to rely on conventional (i.e., mutually-exclusive) quotas on a limited number of characteristics. Why? Because the propensity score is a single, summary measure of a respondent’s entire set of characteristics. In practice, this means that the statistical model can include an exceptionally large number of characteristics. That’s a major advantage over conventional quota-sampling approaches.
Will the approach work for market researchers who commission or run online tracking surveys? As described elsewhere (Terhanian and Bremer, 2012), initial empirical evidence suggests that this is an excellent way to ensure that the characteristics of a sample closely reflect those of a known population. The evidence suggests, as well, that the methodology, referred to commercially as SmartSelect, enables market researchers to choose online survey respondents who provide more accurate information than respondents chosen by other means. Perhaps the last thing to mention here about SmartSelect is its intuitive appeal. It is difficult to think of another methodology that mirrors the steps a 12-year-old takes when deciding which apples to buy to make great-tasting apple juice for his parents.
References
Eggers, M. (2011). “Blend, balance and stabilize respondent sources.” Paper presented at the Annual Conference of the Advertising Research Foundation.
Gittelman, S. and Trimarchi, E. (2009). “The virtues of consistent bias: Online research must move on.” Alert! Magazine, 48, 9, pp. 35-37.
Krosnick, J. (2008). Affidavit of Jon Alexander Krosnick. Phonographic Performance Company of Australia Limited (ACN 000 608 704).
Langer. G. (2009, September 1). “Study finds trouble for opt-in Internet surveys.” ABC News. http://abcnews.go.com/blogs/politics/2009/09/study-finds-trouble-for-internet-surveys/.
Mitofsky, W.J. (1999). Pollsters.com. Public Perspective, 10, 4, pp. 24–26.
Shepard, S. (2012, November 30). “Election reopens debate over online polling.” National Journal. www.nationaljournal.com/politics/election-reopens-debate-over-online-polling-20121130.
Rosenbaum, P.R. and Rubin, D.B. (1983). “The central role of the propensity score in observational studies for causal effects.” Biometrika, 70, pp. 41–55.
Rosenbaum, P.R. and Rubin, D.B. (1984). “Reducing bias in observational studies using subclassification on the propensity score.” Journal of the American Statistical Association, 79, 387, pp. 516-524.
Terhanian, G. and Bremer, J. (2012). “A smarter way of selecting respondents for surveys?” International Journal of Market Research, 26, 6, pp. 751-780.