
Editor's note: Michael Lieberman is founder and president of Multivariate Solutions, a New York research firm. He can be reached at 646-257-3794 or at michael@mvsolution.com. This article appeared in the May 6, 2013, edition of Quirk's e-newsletter.
While at a conference for a popular Monte Carlo simulation software, I noticed something interesting: I was the only marketing research professional in attendance. There were several hundred attendees from pharmaceutical device firms, engineering, finance, computational biology, construction, telecommunications, political forecasting and design but this technique, it seemed, was flying under the radar in marketing research.
A perusal through Web sites of some of the leading marketing research firms confirmed the lack of awareness of Monte Carlo simulations and their usefulness in common research applications, such as ROI, loyalty, product development, customer satisfaction and regression modeling - the bread and butter of our industry.
Predict probability distributions
Monte Carlo simulations are used to predict probability distributions. As a basic example, if you roll three dice, you can get a total outcome from three to 18 with varying degrees of likelihood. Monte Carlo simulations can throw three dice one million times and tell you how likely you are to get a number higher than 10. And what if two of the dice were 12-sided? Or what if the dice were loaded? Monte Carlo simulations can incorporate different probability distributions and give you the skinny about the current situation.
Since the conference, now a few years past, I have deployed the Monte Carlo method on many occasions with terrific results. Moreover, I've realized the researchers who actively promote their simulation prowess often gain a computational advantage. Particularly now with the emergence of big data and predictive analytics, the Monte Carlo method is heading to the front of the queue for sophisticated researchers.
Run through the steps
This article will briefly run through the steps of a Monte Carlo simulation using an example of four over-the-counter (OTC) pain relievers from a major retail pharmaceutical chain, which we will refer to simply as Pharmacy.
To perform a Monte Carlo simulation, we must first create an Excel spreadsheet with cells defined based on their ranges and behaviors. For example, a market for a product might be anywhere between one and two million users. That is, it has equal chance of falling anywhere in this range. In a simple estimate, the researcher sets the market to 1.5 million and the value remains static. Using Monte Carlo, define the cell within the Excel spreadsheet to values between one and two million with equal probability of being at any of them. During the simulation, the value bounces around within its boundaries.
Monte Carlo simulations rely on data input and distributions. For industries like engineering and finance, the inputs come from markets, spreadsheets, etc. Statistician Nate Silver uses a plethora of political polls. For marketing research projects, the inputs come from primary survey data combined with data provided by the end client. In our example, the research firm gathered the sales data for the OTC pain relievers. As additional input, Pharmacy provided us with the retail cost as well as the cost of goods that go into the simulation. This interaction is a common and effective method.
Pharmacy hired us to estimate the profits of OTC pain relievers for four brands on a quarterly basis. The researcher has gathered quarterly sales data from 300 Pharmacy retail outlets. We are now ready to run the simulation.
The simulation
To demonstrate how Monte Carlo works, we will first look at a basic spreadsheet of the data (Figure 1). From our input data, we know the mean sales volume for each of the brands (shown in the red cells). To simplify matters, we will show the figures in the thousands (i.e., 499 = 499,000). Product costs are fixed and gross profit is simply the number of OTC pain relievers sold, multiplied by the profit for each brand. We are looking for total gross profit, which, in this case, is the forecast. 
First, create a probability distribution, referred to as an "assumption," for each brand (i.e., the mean and deviation from the mean for OTC sales). These come from the research data gathered from the 300 Pharamcy branches.
A simple look at the spreadsheet shows our client that his gross expected profit for the next quarter will be around $7.5 million. That certainly may be close to the median point of our simulation but what if the client has other questions, such as "How likely are we to make $8 million next quarter?"
That inquiry is beyond the scope of a single estimate. The researcher shrugs.
Given that sales of each of the four OTC pain relievers sales differ by store, season and chance, the predicted sales change from the mean. This is commonly referred to as "error" (i.e., predictive sales can appear anywhere within the error of their means). Advancing the Monte Carlo simulation one step within distributions can radically change the results. Figure 2 shows a new iteration.
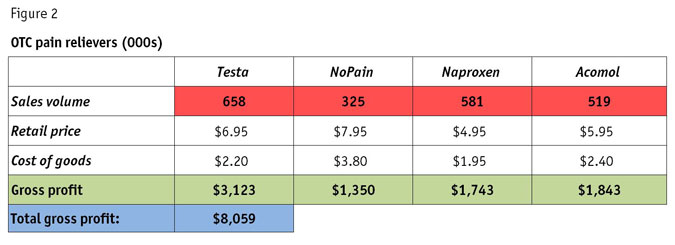
It's quite different from Figure 1. So, which is correct?
Both and neither. They are simply two possible outcomes for our OTC pain reliever sales estimate. The power of a Monte Carlo simulation is that it runs the spreadsheet, say, 10 million times within two to three minutes so that the brand sales can jump all around their distributions with every possible outcome produced and recorded. The cumulative chart shows the outcome of all 10 million simulations and then displays them together (Figure 3). 
Examining the Monte Carlo cumulative chart, we discover that Pharmacy's chances of making $6.75 million or more (in blue) are 80 percent for that quarter (i.e., 80 percent of the simulations are $6.75 million or higher).
The expected value of Pharmacy's gross profit is $7.3 million (in red) (i.e., there is a 50 percent chance of achieving this figure or higher). To answer the earlier question, if Pharmacy requested the odds of an $8 million profit this quarter, we see that $8 million falls somewhere between 20-30 percent so we would estimate 25 percent or so.
Monte Carlo simulations are often used in decision-making. For example, if Pharmacy wanted to know whether to carry the four OTC pain relievers together. Let's say the C-suite indicated they would like a decision point (minimum profit) of $6.5 million. Examining the cumulative tables, we see that $6.5 million falls slightly below 90 percent so we would report that, given the data, Pharmacy's chance of hitting its sales target on OTC pain relievers is around 90 percent - or in other words, excellent.
An added dimension
Monte Carlo simulations offer an added dimension for studies looking to:
- estimate entry market share for a new product;
- forecast sales;
- estimate of actual market size for a product or service; or
- determine maximum product or store arrangements for profits.
As big data becomes the norm and collection methods become more diverse, this sophisticated data analysis method gives us researchers a way to use the vast information to our advantage. Moreover, it may also give researchers a critical edge over competitors who offer one-cell solutions.