Editor's note: Tim Macer, managing director of U.K. consulting firm meaning ltd., writes as an independent software analyst and advisor.
The social media space sits much as some recently-discovered mountain, beckoning the market researcher to climb it. Pioneers that have made the ascent claim the views from the top can be highly revealing. But with the terrain largely uncharted, and few resources provided on the ground, only an elite have been able to scale the heights so far. The arrival of Semeon, a new MR-specific tool for social media analysis, may change this, because it offers an all-in-one solution which is both affordable and relatively easy to use.
Semeon is the first complete social media analysis tool to come out of one of the industry’s established survey software providers. It comes from a start-up company within the VOXCO group, although Semeon works very much as a standalone tool. The platforms are not in any way integrated but it’s clear that a market research mind-set has been applied to the problem of analyzing social media buzz.
Collect then analyze
Semeon divides the task into two familiar stages: collect the data, then analyze the data. This is imposed by the sheer scale of the task it needs to perform and is reflected in the two main screens in the interface of this Web-delivered tool. Google real-time searches have conditioned us all to the fallacy that even the furthest corners of the Web are instantly searchable. Yet these real-time searches are only possible because of the queries that Google constantly executes in the background, with its Web crawlers visiting each site, extracting the relevant text from it and formatting it in a curated library of cleaned-up text that is then amenable to instant searching.
Semeon works in a very similar way but with the important advantage that you can optimize the search to focus on particular sources that are of high value to your research, such as a customer review site, or omit certain sources, such as professionally-gathered news sites. And because the Web is a constantly-moving, dynamic place, it will continue to add or update the documents it finds until you tell it to stop. A particular advantage of this approach is that your research can stray into walled gardens, if you have authorized access to them. Sites you can register for, including those with a paywall, which are beyond the reach of search engines, can be incorporated in the corpus of data built up by Semeon.
Willing to adjust
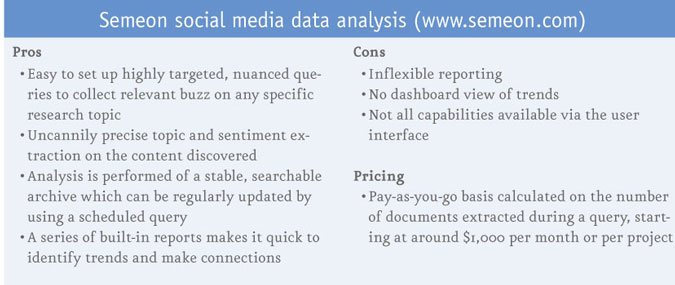
In the search area, a relatively simple wizard-like form lets you define your search criteria – the keywords you are searching for and also the sites and geographies you want to emphasize. It presents you with a series of data sources, organized into industries. Not all of the search capabilities are exposed in the Semeon end-user interface, however, though Semeon is willing to adjust and fine-tune the searches. However, it does mean the query process is not necessarily all that transparent.
You can then schedule your query to run periodically – every day or every week. Repeating the query will only extract new material, which is important, because what you pay to use Semeon is based on the number of documents you pull from all the different sites.
Once a query has run – which can take several hours – you can move to the reporting area. It is here you sense the sheer power of the system. The software is based around natural language processing methods of concept extraction and sentiment extraction, as a means to classify or categorize responses; not so very different from conventional coding of open-ended data. The concept extraction is unbelievably sophisticated. With no inherent knowledge of a subject domain, it identifies themes that are common to multiple documents and effectively suggests a list of topics that read like a directory of all the current issues and trends. It is so good that it is hard not to believe the software, or the guys at Semeon, have not been doing homework on the issues you are researching.
It also does a full sentiment analysis on the topics extracted, so you can see which are positive, negative and neutral. It also offers other sentiment dichotomies, including objectivity versus subjectivity.
Find fairly natural
To turn all this into some kind of report, as any researcher will need to do, you can work on the categories it finds, combining them, and also reviewing each to see what the underlying documents are that it found – the tweets or Facebook entries, news stories or blogs. You can group these or overlay your own grouping structure, in a way that any qualitative researcher should find fairly natural. Other analysis methods include associating topics and sentiments with the different sources, down to the individual, with a graphical network of influencers and their connections as one of the report options.
The range of reports in this first production version of the software is somewhat limited. In an attempt to automate report production and provide a set of canned reports, the experience for most analysts is likely to be that they feel somewhat excluded from the report production process. You have to take what you are given, to a large extent. Reports sit outside the query and analysis windows, at a project overview level or attached to the instance of the query, so some distance from where the actual analysis is done. I am sure it is an area the developers will be working on.
And beyond the reports, I was expecting it to provide some kind of summary dashboard so that topics and sentiments can be tracked over time but that is not something it currently does. So while Semeon is good on discovery, it falls somewhat short on presentation in its current incarnation.
‘Thought it was easy to use’
I spoke with two very different users of Semeon. Sylvain Sénécal is a marketing professor and RBC Financial Group E-Commerce Chair at HEC Montréal Business School. He has introduced Semeon as one of the tools his students can use in a course devoted to Web analytics. In this case, his 26 students used it on a project to look at branding and the social network buzz around different travel guides. “We exposed them to different methodologies and software and in comparison to some of the others, they thought this was easy to use,” says Sénécal.
Asked whether it makes more sense as a quantitative or a qualitative method, he says: “It’s an interesting question. Before you use it, you would tend to qualify it as a qualitative but it also moves you towards a quantitative approach. You will find concepts but at some point you will find you are looking at the numbers too. So I think it helps analysts move from the in-depth insights that make up qualitative research into what is an overall picture, which is a bit more quantitative.
“But I also tell my students they need to be careful. You may have huge numbers of people mentioning stuff but this is not necessarily representative, because it is not probabilistic. It is the same problem with other quantitative tools, if the sampling technique is not probabilistic. This helps bridge the gap between qualitative and quantitative but there are bigger questions about the people that are on social media and how representative the people are [that are active in social media], of the market as a whole.”
Despite these concerns, Sénécal sees value in the approach, in making analysis of social media more rigorous. “The major advantage of this kind of tool is it helps you to analyze the data and easily interpret it. You can easily collect 2,000 tweets about just one hashtag but humanly what can you do with this? It would very time-consuming and tedious to do anything with it. This helps you filter and analyze the content. The information is out there but the main benefit of this is that you can gather it into one place and make sense of it.”
Christine Matthews runs Bellwether Research, a Washington, D.C., political research company. Matthews used Semeon alongside conventional quantitative research for a project following last year’s gubernatorial and U.S. senate election in the state of Indiana. “This was my first foray into sentiment analysis for social media,” says Matthews. “I wanted to complement the quantitative work to view how these races were being viewed in social media.”
Initially she hoped to control the software directly but the transition to a new method and new software too proved too much, in the heat of running a project during a fast-moving political campaign. “I had hoped I would be able to run some searches and be able to go into the ‘back room,’ but I just couldn’t do it; it was too hard,” she says. Instead, Semeon supported Bellwether, defining and refining the searches and e-mailing over regular reports.
On one fateful day during the campaign, Richard Mourdock, Republican senate candidate for Indiana, made controversial comments about rape and abortion similar in sentiment to those made a few weeks earlier by Missouri’s Todd Akin. “It’s such a cool thing to have social media monitoring when something like this happens,” Matthews says. “Twitter goes wild – everything does. It’s crazy.”
Yet out of this chaos, Semeon immediately identified the trending sentiments and topics and the strong associations between Mourdock and Akin, about two days before it was reported in the news media. “We had a good idea Mourdock wasn’t going to win even before our poll showed he was behind,” Matthews says. It also meant she was able to add specific questions to the poll on this and other topics that were trending. “Increasingly voters are expressing their opinions in social media,” she says. “Quantitative response rates have fallen to around 9 percent. [Analyzing data from social media] adds a very important layer to understand what voters are saying. It is not a replacement but it is a critical component to it. Social media is frustrating in its lack of ability to track back to demographics but it adds valuable layers of understanding. I definitely want to use this, going forward, but we still need to do our quantitative to make it legitimate and representative.”
Discovery tool
This, in fact, appears to be the ideal way to use Semeon: not as a single source of information but as a rich discovery tool that adds layers of meaning to what is being measured in more conventional quantitative surveys or even to inform the design of those quantitative surveys. This tool deserves a place in every research team’s toolkit, despite its current limitations in providing presentable reports or dashboard summaries.
