Creating a single-source methodology to harness insights of today’s ‘new’ consumer
Editor’s note: Maria Domoslawska is vice president, global strategy and research, Research Now Digital, U.S. Heather Dougherty is director of research, strategic services, Experian Hitwise, U.S. For more information, contact us at digitalUS@researchnow.com.
Introduction
This paper¹ examines work that has been carried out in support of a single-source methodology in order to understand how, when applied to consumers’ devices, the new research tracking technologies complement and enhance the traditional survey question approach. The aim of this research is to better understand the complex world of multiple devices and how consumers engage with them, and to establish standards for a research methodology that assesses the current multichannel communication scheme.
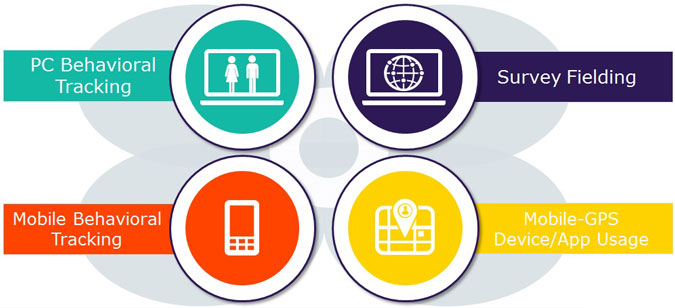
Figure 1: Single-source research methodology
Single-source approach describes how respondents are tracked for behaviors on different devices.
Context
Technology has replaced the middleman, creating endless opportunities for consumers to search and purchase a product, as well as interact with brands. For brands, technology has opened up new channels of communication, offering a broad spectrum of targeting capabilities. Displaying the right message to the right person at the right time has, for the last few years, been the mantra of online media companies.
Consumers are now the center of attention and their online lives are no longer a mystery. They can be metered, tracked and cookied with the newest technology — which is transparent, precise and permission-based, with no hidden spyware or pop-ups. Consumers are also no longer "hiding" online or pretending that they are someone else with a higher household income, better car or a different lifestyle. Today there are too many benefits to being who you really are online.
Experian Marketing Services and Research Now have collaborated in an effort to provide new insights of today’s consumer, to help brands better understand customers’ wants and needs. A single-source, multimode approach used in this study aims to uncover new trends and patterns in consumer behaviors during the busiest shopping times of the year. In addition to behaviors, respondents’ survey answers and a robust demographic and segmentation scheme are used to demystify the new digitally-engaged consumer.
Experian Marketing Services has over a decade of consumers’ online behavioral tracking data with expertise in consumer’s behaviors, online seasonality and trends. Their proprietary Web taxonomy and norms guide online brand strategies across all industry verticals.
Research Now offers over six million active panelists globally with a proven opt-in approach and infrastructure that has been optimized over the last decade and became the secret formula behind one of the most reliable samples in the market research industry.
Historical data
Experian Marketing Services’ historical data shows that end of year holiday shopping is retailers’ hot target as consumer online traffic and activities have consistently grown globally during that time, year-over-year. With this in mind, we designed a single-source methodology and conducted two research projects in the United States and the United Kingdom. The dates of the studies were derived from the Experian Historical database to ensure the best success rate for the project, taking into account consumers' activities, available panel size, technology for tracking behaviors, and the best survey response rate.
Background
The first study was conducted in the United States during the last two weeks of November, which are the busiest retail days in North America. The tradition of Thanksgiving Day has been disrupted for years by retailers who have created Black Friday and Cyber Monday sales to jumpstart holiday shopping.
Experian Marketing Services’ historical online data of top U.S. retail Web sites shows the shifts in spikes year-on-year between these key shopping days and, therefore, the main aim of the study was to better understand the consumers’ behaviors and motivations behind it. In addition, a mobile component was added to measure the smartphone apps usage to understand the impact of apps on shoppers’ behaviors.
Methodology
A single-source methodology implies that the same groups of respondents were invited to participate across different methodology modules — Web-based survey, online Web site user visitation tracking, mobile Web site visitation tracking, mobile app behavioral tracking, and in-store visitation tracking based on mobile GPS (Figure 2).
Figure 2: Multimode approach used in the U.S. study with sample size of each module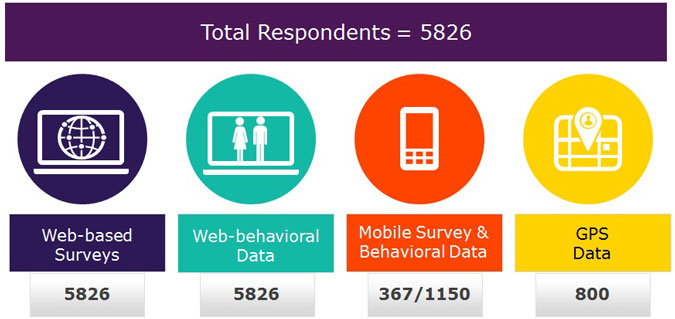
The U.S. study took place during the last two weeks of November, starting the Monday before Thanksgiving and ending the Friday after Cyber Monday. The web-based survey was conducted a couple of days prior to the Thanksgiving holiday, and the behavioral tracking was monitored November 19 through November 30, 2012.
In the U.K., the biggest holiday when retail traffic takes place is at the end of December, with Christmas Day being one of the highest traffic days in online retail visitation. Overall, year-on-year, Experian has been noting growth in online visitation and hours-spent on the U.K. retailers sites.
Therefore, the fieldwork for the second study in the U.K. took place in December, and online behavioral tracking was monitored December 1, 2012 through January 15, 2013 (Figure 3).
Demographic profiles
In both studies, the demographic profiles were representative of the general population in each respective country with a fair distribution among age, gender, household income, and social grade in the U.K. and education in the U.S.².
Figure 3: U.K. study with sample size and timing of each module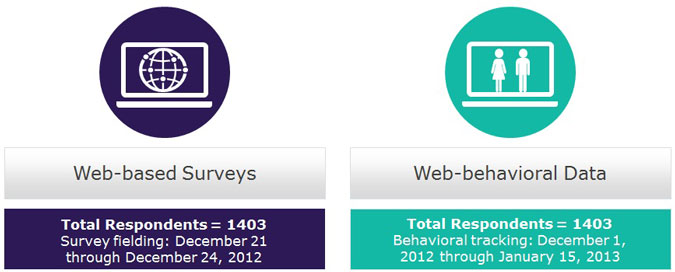
Segmentation
The segmentation scheme used in this study is based on Experian Marketing Services’ Mosaic®³ global segmentation network, which classifies more than one billion people worldwide. The segment definitions are based on a variety of strategic data sources own by Experian globally. For this study the aim was to apply the Mosaic segmentation to the study respondents to better understand their psychographics and motivations to help uncover the most effective channels of communications during the holiday shopping season.
Findings
Traffic
Using the top 20 U.S. retailers from the Experian Historical data, we tracked respondents’ browsing and visitation behaviors on PCs, mobile devices and in physical stores. We wanted to find out how the traffic was distributed between the different devices and channels.
In reference to Figure 4, the blue bars show results from our PC meter with a sample of 5,826 respondents. The middle red bars show results from a mobile meter with a sample of 1,150 respondents. And lastly, the teal bars on top show results from our GPS, location-based capability, tracking a sample of 800 respondents.
Figure 4: Consumers' traffic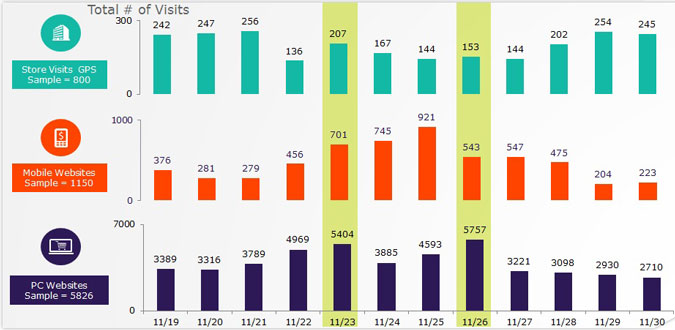
Looking at the teal graph on top, we note that November 22 was Thanksgiving Day and during the three days prior to it the in-store traffic was high. On November 22, the in-store traffic was much lower, with a majority of stores closed in observance of the holiday. Yet, if we look at the other bars (in red and blue) in Figure 4, we note that PCs traffic was much higher during Thanksgiving Day indicating that respondents, while at home celebrating the holiday with their families, were also browsing the retailers’ Web sites in search of upcoming Black Friday deals.
On Black Friday, we note that the traffic was not as high as compared to the pre-holiday days for those shopping in-store; if we look at the other bars, we can see the majority of traffic was on PCs and mobile devices. This further illustrates the success of online sales and promotions and confirms declining in-store traffic which is now consistently replaced with PC and mobile shopping
If we look at the traffic over the weekend, November 24 and 25, we note that respondents were doing even less shopping in stores – and less on their PCs as compared to November 23, but they were still browsing the retailers’ Web sites on mobile devices. In fact, the highest traffic on mobile devices was observed on Saturday and Sunday during these two weeks, which aligned with a new trend seen in the industry (i.e., high mobile traffic on weekends). This data uncovers new channels for brands to engage with consumers.
Store visitation
We designed a simple test to see how intent and actual behaviors align or differ. By asking respondents in a survey to report which retailers (from the top 20 Experian list) they were planning to visit in the upcoming weeks, we established a ranking distribution and we tracked respondents — again, with their permission — on their smartphones with an activated GPS location-based capability. We netted all stores nationwide to track who, among our survey respondents, visited the retail stores from our top 20 list. The biggest finding from this exercise was a clear misalignment between the ranking of intention from the survey question and the passive behavioral tracking. Although respondents reported their intention of going to said stores, the behavioral data shows us that they did not do so.
Web site visitation
We conducted a similar test with a Web site visitation on PCs and mobile devices and found two new insights. Firstly, PC browsing is much more established, and survey intent data and the actual behavioral data are more closely aligned in both the U.S. and the U.K.
However, with mobile Web site visitation intent, the same thing happened as with the GPS tracking. Even when respondents said they were going to browse certain retail Web sites on their mobile device, they did not end up on the same Web sites as intended. The ranking order was again different between survey responses and the mobile Web site browsing (see Figure 5).
Figure 5: Top 10 site visitation ranking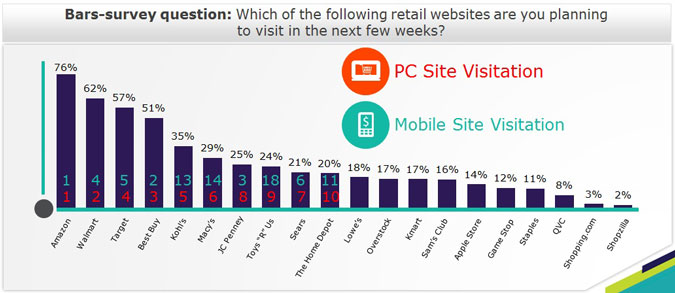
Smartphone app usage
The last section to highlight relates to smartphone app usage, as it helps to support some hypotheses we had regarding consumers’ changing behaviors. As mentioned, we had noticed whenever we track mobile devices against consumer reported intent there were differences in what they say and what they actually do. To explain this, we have monitored the smartphone app usage over a period of two weeks among a subgroup of respondents.
Respondents had been using apps on their smartphones and had confirmed that they had downloaded retailers’ apps from our top 20 list. However, almost no one was using the retailers’ apps during the busiest shopping time of the year. The majority of the time spent on smartphones during that time was on Facebook, videos and games. Among our group of respondents, a staggering 11,004 hours were spent on Facebook, an average of 76.5 minutes a day on Facebook per each respondent.
Additionally, we tracked respondents’ smartphone app usage at selected stores and found that, while they were in stores, they used their smartphones but, once again, not for retail related activity (Figure 6).
Figure 6: Consumers’ smartphone usage share of time while at Walmart stores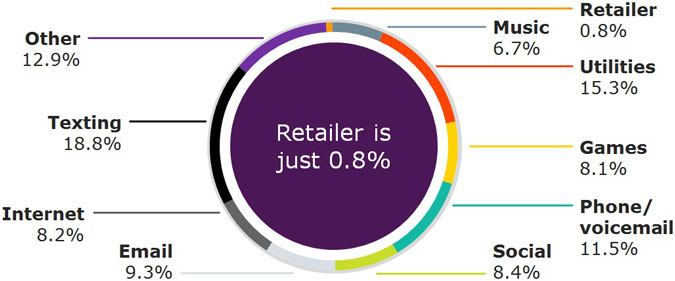
Source: Passive data for 63 panelists, 69 hours of smartphone usage
So, for retailers hoping for a high usage of their smartphone app, this didn’t necessarily occur. However, once again, this presents enormous opportunities for brands to engage with consumers at an individual level. As smartphone and tablet usage continues to increase, apps will play an increasing role in providing an enticing experience for customers seeking a more tactile experience than merely Web browsing.
Segmentation
In both countries, we surveyed respondents about their shopping mind-set. In the U.S., we wanted to know about timing and which sales respondents were planning to shop at. In the U.K., we were interested in knowing who they typically shop for during the holidays. In both cases, the questions were single-choice, allowing for the segmentation of respondents and mutually exclusive groupings.
For example, we asked the question, "When do you typically do the majority of your holiday purchasing?" (Figure 7). We found that the early shoppers tend to be Flourishing Families, which are affluent and family-centric. Additionally, there is the Pastoral Pride group, which is older and more value conscious, but also tech-shy. Black Friday is the day for those in the Suburban Style and Family Union groups — both tend to be more ethnically mixed, with a higher concentration of Hispanics, heavier Internet users, and value conscious. They, therefore, take advantage of the Black Friday sales both online and off.
Figure 7: Affluent households less interested in early sales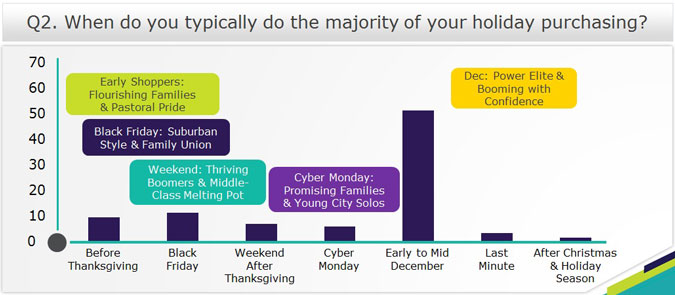
Conclusions
In short, it is a business and a brand imperative to measure and evaluate consumer behaviors holistically in the same way shoppers use technology in a seamless fashion.
What people say they search for online and what they actually do online often are not the same. Understanding precisely what consumers say and do across devices is crucial to being successful and since consumer behaviors are constantly changing it is fundamental to track overtime.
The traditional path to purchase has changed beyond recognition in all aspects of the customer shopping experience. New channels, such as mobile, are not as predictable as the established PC behaviors. Consumers are much more likely to do what they say they will when it comes to online shopping via PC, but this does not translate to mobile shopping or even in-store visits.
Smartphone apps are of significant value to brands, given the amount of time and multitude of tasks consumers perform on their smartphones. Nevertheless, the technology is nascent in terms of adoption and needs to develop its own voice to capture consumers’ attention in the moment.
Understanding the in-depth segmentation of consumers is also important in creating a better brand experience. Consumers recognize the value of new marketing and now expect to be offered a personalized message, irrespective of platform or device.
Footnotes
- This paper was originally presented on September 22 at ESOMAR Congress 2013 in Istanbul. Research Now and Experian Marketing Services will be conducting similar research for the 2013 holiday shopping season. Data from this research will be available in early March 2014.
- The only difference we would note is among the U.S. sample, as there were some statistical differences between the groups who were tracked on PC and Mobile. In this instance, PC profiles were skewing toward an older, less affluent male audience while mobile had younger, more affluent females.
- The Mosaic® system is a household-based consumer lifestyle segmentation system that classifies all U.S. households and neighborhoods into 71 unique segments and 19 overarching groups, providing a 360-degree view of consumers’ choices, preferences and habits. The new Mosaic system is the first segmentation tool built in the U.S. market in the past five to 10 years and reflects critical new data presented in the 2010 U.S. Census.