Editor's note: Jonathan Asher is executive vice president at Perception Research Services, Teaneck, N.J. He can be reached at jasher@prsresearch.com. This article appeared in the March 24, 2014, edition of Quirk's e-newsletter.
In today's high-tech world, where consumers think nothing of engaging in discussions with their computer via Siri or accessing apps while walking the streets via Google Glass, it's hard to imagine the level of resistance and skepticism that researchers faced when introducing eye-tracking technology for MR back in the early 1970s. At that time, eye-tracking, which uses corneal reflections to record where consumers are looking, was used primarily for military, medical and scientific applications.
Since then, eye-tracking has become a widely-accepted and validated technique in the marketing research industry. In fact, researchers, marketers and even designers have embraced eye-tracking research in determining how well their marketing materials will perform. For example, does the marketing break through clutter and gain consideration (e.g., do shoppers even see a package within a cluttered shelf?)? Does the message hold attention and highlight key marketing messages (e.g., do shoppers engage with specific on-package elements/claims?)?
Cheaper alternatives
Given the widespread use and adoption of eye-tracking, it's no surprise that cheaper alternatives have been brought to market. Two such offerings have recently been promoted as substitutes for eye-tracking:
- A mouse-clicking exercise conducted via a computer-based interview (click-what-you-saw).
- A software algorithm intended to predict visual attention without actual consumer research (visual attention service [VAS]).
While some consider these techniques alternatives to eye-tracking because they aim to provide indications of visibility, the technology and science - or lack thereof - are actually quite different.
Comparing their outputs
We at PRS recently conducted parallel research to understand the validity of these approaches by comparing their outputs directly to those generated using eye-tracking (via in-person interviews).
Eye-tracking vs. click-what-you-saw
To gauge this methodology, we fielded a series of parallel packaging studies. In each study, one set of 150 shoppers went through an eye-tracking exercise (recording what was actually seen - as it occurred - while viewing a series of cluttered product categories at the shelf and individual packages) conducted via in-person interviews in multiple central location facilities across the U.S.
A matched set of 150 shoppers, with similar demographics and brand usage, saw the identical set of shelves and pack images via the Web and were asked to click on the first three things that caught their attention within each visual.
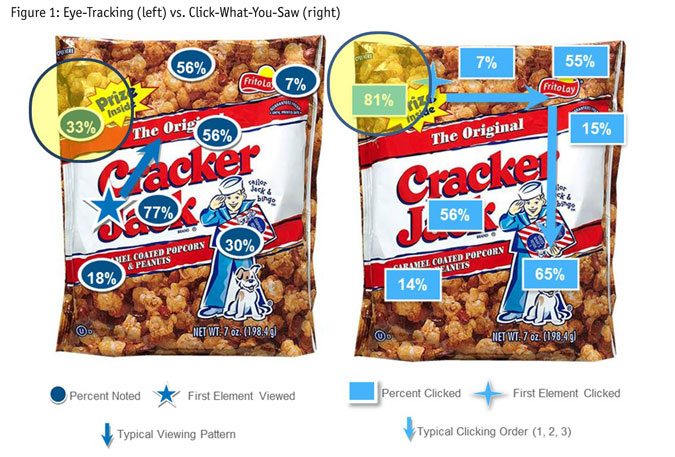
As the Cracker Jack example in Figure 1 illustrates, the data varied dramatically between the two techniques.

While 81 percent of Web respondents clicked on the "Prize Inside" burst as one of the first three things they saw, eye-tracking revealed that only 33 percent of shoppers visually noted that element as they viewed the package. Thus, the clicking method overstated the actual visibility of this claim.
Visibility levels varied widely between methodologies for several other packaging elements, including the background popcorn (56 percent noting via eye-tracking vs. 7 percent clicking) and the Jack-and-Bingo visual (30 percent via eye-tracking vs. 65 percent via clicking). In addition, the primary viewing pattern (represented by the arrows) also differed between the two methods, with varying start points (branding vs. burst) and flows.
In addition to comparing the outcomes on an absolute basis for a given package, we also assessed the shifts that each technique demonstrated between the control (current) and test (proposed) package (not shown due to confidentiality).
Specifically, we analyzed whether the approaches would lead to similar conclusions on whether the test design was increasing or decreasing the visibility of specific design elements (e.g., the "Prize Inside" claim, the main visual, etc.). This is particularly important because these findings are critical in driving recommendations for design refinements (i.e., enhancing readability of the flavor name).
In the Cracker Jack example, the findings from the two methods were dramatically different. Eye-tracking revealed that the test packaging increased visibility of two of the five primary packaging elements, while decreasing the visibility of three other elements. For example, eye-tracking showed that the visibility of the "Prize Inside" flag was significantly higher in the test design vs. the control.
The clicking method reached the opposite conclusion on four of the five design elements. Clicking suggested that the "Prize Inside" flag had significantly lower visibility in the test design vs. the control. Similar patterns were observed across many of the cases in which we ran parallel tests, on both shelf visibility and package viewing patterns. This suggests that relying on the click-what-you-saw method will likely result in suggesting very different types of design refinements than if using noting scores from eye-tracking.
Driving the differences
What do we believe is driving the significant differences between the methodologies? Across packages, the clicking data is higher on more cognitive - and perhaps more compelling - elements of the pack (i.e., the prize), while it is lower than eye-tracking on more mundane - and perhaps less unique or compelling - elements, such as the popcorn. It is possible that rather than clicking on what they first saw, shoppers are actually clicking on what most interested them. This hypothesis makes intuitive sense, given that the clicking exercise requires a conscious thought process, while eye-tracking measures actual eye fixations, which are an involuntary, physiological activity.
While the clicking exercise may offer value as part of a research study if used/interpreted properly (e.g., "click on what you liked"), it is clear from this data that this technique should not be utilized as a substitute for eye-tracking, as it does not document what people actually see or miss.
Eye-tracking vs. visual attention service
The VAS service is a software algorithm that is used to predict eye-tracking results. No actual consumer research is conducted. One simply uploads an image of a shelf, a package, etc., and the software calculates the visibility of different elements within the image.
To assess this technique, we loaded 20 images (of 10 shelves and 10 packs) into the VAS software and compared the results to those gathered from eye-tracking of the same images (conducted in central location studies, among an in-person sample of 150 shoppers).
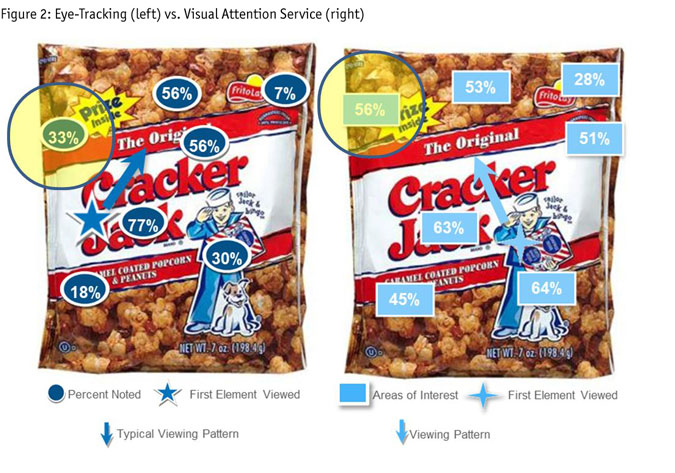
Figure 2 shows the same Cracker Jack package with the eye-tracking findings compared to the VAS results. As the illustration reveals, the VAS results showed far less differentiation among the packaging elements, as most results were in the neighborhood of 50 percent, and it overestimated the visibility of the "Prize Inside" claim (56 percent vs. 33 percent from eye-tracking).
More importantly, the VAS system did not demonstrate differences between the control and test packaging. While eye-tracking revealed significant differences between test and control in the visibility of all five primary design elements, the VAS system predicted no differences.
These two primary themes from the Cracker Jack case were repeated across multiple examples. The VAS system was particularly weak in accurately predicting the visibility levels of on-pack claims and messaging, as it frequently projected higher visibility levels than documented via eye-tracking.
Additionally, the VAS system did not appear to be very sensitive to detecting differences across design systems. In fact, we found that over half of the research conclusions would have been different using the VAS system vs. eye-tracking. Again, as with click-what-you-saw, this suggests that relying on the VAS technique will likely result in suggesting very different types of design refinements than if using noting scores from eye-tracking.
Driving the differences
What do we believe is driving the significant differences between the methodologies? While we were able to develop a hypothesis on the clicking data as to why it differed from the eye-tracking, there seemed to be little predictability with the VAS software. Simply put, the algorithm did not appear to be sufficiently sensitive or accurate enough to correctly predict actual shopper eye movement in the context of complex shelves and/or packages.
Is no substitute
This parallel research shows that neither click-what-you-saw nor VAS is a reliable replacement for actual eye-tracking. While there may be other valuable uses of these tools, they should not be considered substitutes for quantitative eye-tracking. If the objective is to learn what shoppers see or miss, there is no substitute for actual in-person eye-tracking.