Editor's note: Michael Lieberman is founder and president of Multivariate Solutions, a New York research firm. He can be reached at 646-257-3794 or at michael@mvsolution.com. This article appeared in the April 21, 2014, edition of Quirk's e-newsletter.
The job of the statistician is evolving. It's no longer a number-crunching, quant-only profession as end users expect more dynamic deliverables. A statistician's work is becoming interdisciplinary and, according to Simon Chadwick of Cambiar Consulting, even sexy. At least that's what Chadwick said at the CASRO Digital Conference in San Antonio in March. Chadwick also said that with the exponential explosion of data, storytellers will be more and more in demand. The C-suite will be searching for those who can sift through the noise and distill the story of the research down to a manageable action plan.
I write novels. As a hobby. I've written nine so far - four published and none successful. Writing is a terrific hobby for a statistician. As I like to say to my clients, if one can write a novel, one can write a memo.
Creativity is in.
The nature of statistics
When my students in the Principles of Market Research online course from the Georgia Center for Continuing Education encounter the statistical module section and begin throwing panicked questions my way, I always respond: Statistics is a numerical description of an event. If you understand the event, the methodology follows.
-
A mean is simply an average of a group of numbers.
-
A standard deviation is the average distance of each point from the average. The larger the standard deviation, the more dispersed the numbers. A small standard deviation means a tight group of input.
-
Regression analysis shows which variables are statistically linked to the dependent variable.
-
Segmentation is the statistical grouping of individuals based on behavior or attitudes.
-
Conjoint analysis describes, by statistical methods, the greatest variables in the choice process.
A basic principle of marketing research
When beginning a new project, I ask the client "At the end of the process, what would you like to hold in your hand?" My golden rule in any marketing research project is to begin with the end in mind.
In other words, solve the problem. Then work your way backward on methodology.
I would like to illustrate this point using a fictional study that begins with the end in mind and then creatively uses statistics to give the client the tools to make a business decision.
Johnny's American Diner
Johnny's American Diner is a fictional diner chain located primarily in California (named after Marlon Brando's character in The Wild One). Johnny's American Diner has begun to open branches in the South and in major malls in the Philadelphia area. Given its expansion, Johnny's American Diner would like to revise its menu.
The first step for a menu redesign is to decide which items to remove. That's where we, the researchers, come in. Johnny's American Diner hired us to design a study with two goals in mind: 1) to evaluate the existing menu and 2) to test-drive possible menu items.
Creative statistics were employed in this first task.
Item purchase intent to TURF
The first section of the Johnny's American Diner study was to list all of the current menu items. Respondents were asked to use a scale from 1 to 5 to rate how likely they would be to order each item. This is a typical construction for a total unduplicated reach and frequency (TURF) analysis. Variables were recoded (1, 2, 3 = 0; 4, 5 = 1) into not likely or likely. These values will play an important role in the analysis later, even though TURF was not a primary deliverable in the study.
Creative questionnaire development - sequence weights
The second section of the study, originally developed by Mitch Markel of the Benenson Strategy Group, was constructed specifically to evaluate the sequence of menu choices respondents make. Johnny's American Diner envisioned a survey where respondents would be isolated within menu categories. Based on their choices in the TURF section and what time of day they said they usually visited Johnny's (referred to as daypart), respondents were placed into splits where they were asked to choose among menu items. No respondent was placed into more than two menu categories. Below is a table of how the selection of menu category was performed.
| Daypart | Possible Menu Category |
| Breakfast | Breakfast - Drinks |
| Lunch/Dinner (selected Burger/Sandwich) | Burger/Sandwich - Sides - Drinks - Desserts |
| Dinner (selected Dinner Combo) | Dinner Combo - Drinks - Desserts |
A respondent would be sent to a menu category and asked "Which of these items would you order first?" Once they chose, they were then asked "If this item were not available, what item would you choose next?"
Sequence weights were created in the following way: If an item was the first in a category, it was given a sequence weight of 1. For example, there are 12 possible drink items. If one chose Large Lemonade first, his sequence weight would be 12/12 = 1. If Large Soft Drink was chosen second (after Large Lemonade is removed from the choice set), it would receive a sequence weight of 11/12 = .92. And so on until the respondent answers "No other item."
Given that different categories had different number of items, the weights are not balanced. Burgers - Sandwiches had 15 forced choices so the second-choice weight would be 14/15 = .93. For Dinner Combos, a category with only 10 items, a second-choice would be 9/10 = .90. Very few respondents ran through an entire category but the same problem would hold at the bottom. The lowest weight in Dinner Combos would be 1/10 = .10. The lowest in Burgers - Sandwiches would be 1/15 = .07. All items that were not chosen received a sequence weight of 0.
An adjustment was needed to view the choice weights across categories equally.
Menu category weights
The full-service marketing research client and I brainstormed. We came up with a creative solution. We decided to weight each category by the number of items ordered in the TURF section to balance out the sequence weights.
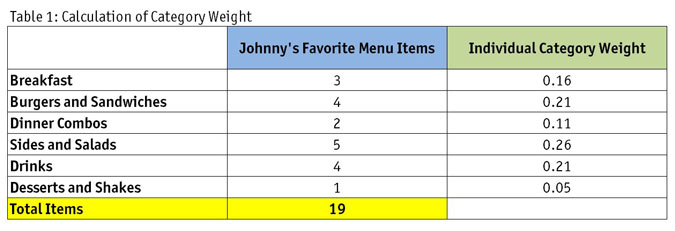
Each respondent was likely to order a different number of items from differing categories. So we decided to add up all his menu choices, then divide that number by each category. The individual category weight would be calculated based on the number of items from each category a respondent chose (Table 1).

Final item weights
The final item weights were then calculated using the two weighted dimensions.
Item Weight = Sequence Weight x Category Weight
Developing the picture
We now have weights for all the items on Johnny's menu (many of them 0 because they were not chosen) and it's time to start developing the picture. But a typical weight might look like this:
| Sequence Weight | Category Weight | Item Weight |
| 0.87 | 0.26 | 0.2262 |
Let's say that we averaged the item weight across all the respondents and found that Large Soft Drink has an average weight of .35. What does that mean? Is that good?
The answer, as most statisticians will tell you, is "That depends." It depends on whether that weight is higher or lower than the weight of a Cheeseburger Deluxe, for instance. How much higher? How does Johnny's American Diner make the decision of which items to cut - and which to promote - based on .35?
Percentiles
Another word to the wise: Always present your findings in a manner that the end client can understand at a glance. In this case, the answer is creating percentiles.
A percentile is a measure indicating the value below which a given percentage of item weight in a group of item weights falls. For example, the 20th percentile is the value (or score) below which 20 percent of the item weights may be found. If a score is in the 86th percentile, it is higher than 86 percent of the other scores. Creating percentiles is easy. The highest value is 100 percent and the lowest is 0 percent. The percentages between are the relative distance each item is from the top or bottom.
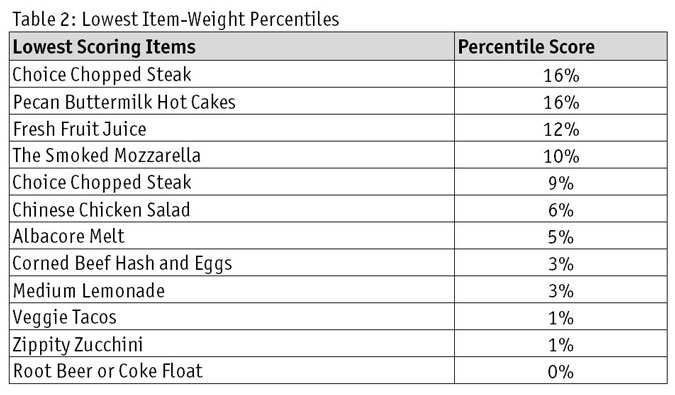
We reported the percentiles to the Johnny's management team. The initial report, given that Johnny's wants to cut items from the menu, shows the bottom 12 items by item-weight percentile (Table 2).
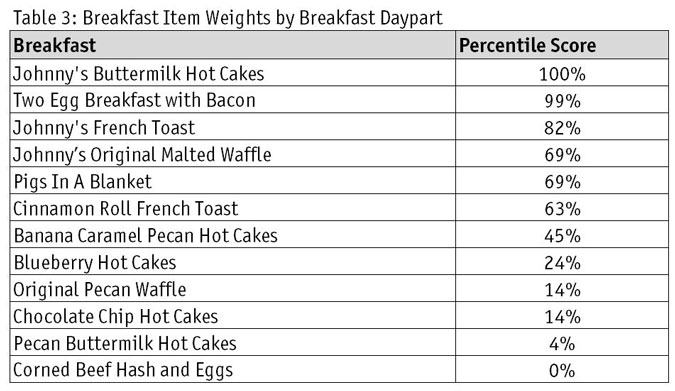
The production of percentiles for item weights is also very flexible. Johnny's asked us to filter the item weights by only those who visited the restaurant for breakfast. Moreover, they would like to see only breakfast items in the percentile chart. Table 3 shows the percentile output of this filtered request.
At the end of the process, Johnny's American Diner received the tools to make decisions. We delivered an easy-to-read snapshot of Johnny's menu-item demands.
Creatively produce actionable results
As the creation of data multiplies at an exponential pace, it falls more and more on the marketing researcher not only to design the study but to creatively produce actionable results.
You don't have to be a statistician - or a novelist - to create results similar to Johnny's American Diner's choice item weights. You must simply understand the question that needs to be answered, the goal of the study to be reached and how to use simplicity and statistics to deliver sophisticated output.