Does interesting have to mean different?
Editor's note: Sara Farbry is senior director of methods at Rockbridge Associates Inc., a Great Falls, Va., research firm.
It is common knowledge in the research profession that survey respondents have become fatigued and bored while taking online surveys, leading to poorer data quality and lower response rates. Therefore, researchers have attempted to retain respondents’ attention by incorporating methods that we hypothesize make the survey more interesting, such as gamification and creative formatting. One of these techniques is visual scale enhancements. But as these scale enhancements are introduced into surveys, researchers have to wonder if they affect respondents’ ratings, particularly if there are plans to “upgrade” a tracking survey after it has been in field for a period of time. This article intends to show whether there is an ideal method for scale formatting by analyzing results from an experiment to test different formats in an online survey.
The experiment was embedded in the National Technology Readiness Survey (NTRS) conducted by Rockbridge Associates in early 2014. The study measures Americans’ technology beliefs and behaviors and is based on a random, demographically-balanced sample of 1,230 U.S. adults age 18+, using online samples derived from two reputable national panels.
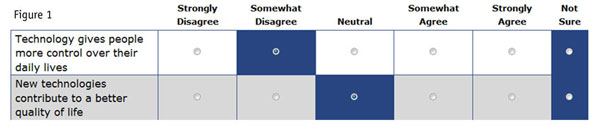
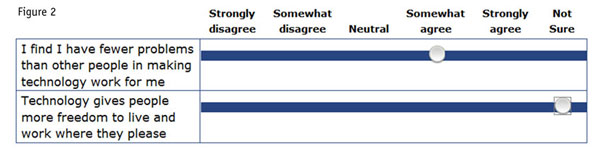
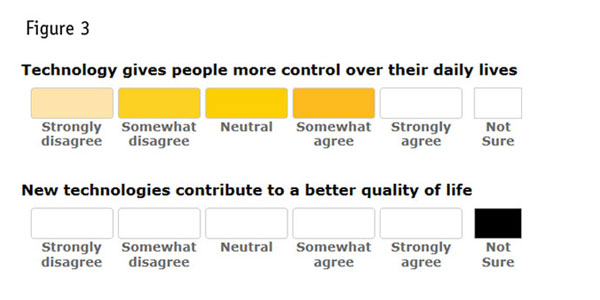
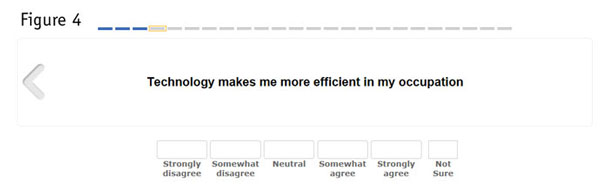
One of the survey’s main objectives is to monitor consumers’ propensity to adopt new technology using the technology readiness index, which is a validated scale based on 16 questions measuring positive and negative beliefs about technology. In the study, an equal number of respondents received these questions in one of four formats. The four variants tested were 1) traditional radio buttons in a table format (n=253, Figure 1); 2) sliders in a table format (n=265, Figure 2); 3) scroll bars in a table format (n=257, Figure 3); and 4) carousel rotation, where each attribute is asked one at a time (n=260, Figure 4).
The scales were compared on a number of factors to assess their psychometric properties. The factors include: measurement biases, to determine whether response tendencies varied by scale; reliability, to understand the impact of scale format on consistency of measurement; validity, to ensure the scale was measuring the correct construct; and quality, to encourage thoughtful responses.

Estimate response tendencies
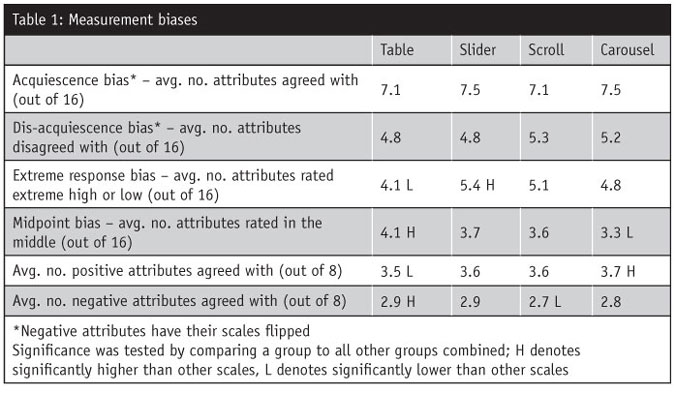
Looking at different measurement biases provides a way to estimate response tendencies. For example, some respondents may be more likely to agree with items regardless of content (acquiescence bias, or “yea-saying”) or to disagree with items (dis-acquiescence bias, or “nay-saying”)1.
A more radical response style exists where respondents endorse the most extreme response categories regardless of content (extreme response bias). The opposite of this is the midpoint responding bias, which is the tendency to use middle scale categories regardless of content1.
These metrics are also of interest to researchers comparing results across multiple global markets because of cultural influences on response tendencies. To illustrate, the tendencies of East Asian countries are to provide ratings closer to the middle of the scale2 whereas those in Spanish-speaking countries are more likely to have “extreme” responses3. By identifying these “biases,” researchers are able to develop indexes that allow them to directly compare results across markets.
While there is not necessarily a right or wrong response tendency, there is evidence that different scale formats will result in varying responses (see Table 1). For instance, respondents who rated attributes in a table format are significantly less likely to have “extreme” responses but are more likely to provide responses in the middle of the scale; they are also more negative in their responses. Conversely, those using the carousel format are significantly more likely to provide positive ratings.
A sound measurement instrument
Reliability and validity are important characteristics of a sound measurement instrument. Reliability refers to the general consistency of a measure and validity provides information on whether the scale is measuring what it’s supposed to be measuring. Knowing the impact of scale formats on these measures allows researchers to determine if and how the psychometric properties of the scale were affected. As an example, scales that are difficult to use or understand will lead to respondents rushing through their answers or providing inaccurate responses – garbage in, garbage out!
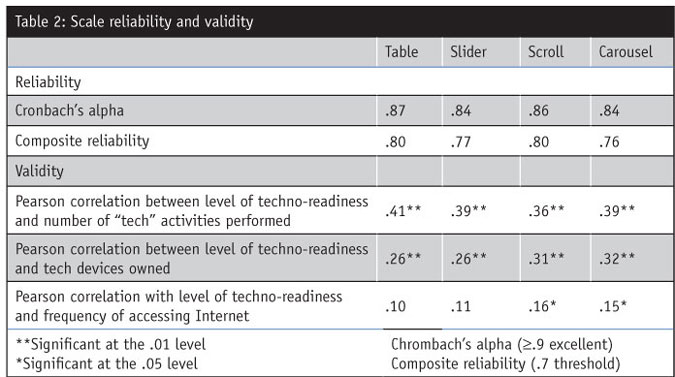
Reliability was assessed with two measures. One was Cronbach’s alpha, a standard measure of scale reliability. Another was a more rigorous measure of composite reliability (CR) using confirmatory factor analysis, a common technique for evaluating scales. In the latter approach, the CR was estimated for four individual subcomponents of the technology readiness index; the average CR is reported here. Both measurements of reliability demonstrate that all scale variants are highly reliable though not greatly differentiated.
A common method for assessing validity is the degree to which a scale correlates with a proxy measure that captures the same or a theoretically related construct; a flawed rating scale would create “noise” that would undermine validity. The 16-item technology readiness index was designed to gauge consumers’ level of techno-readiness, or propensity to adopt and embrace technology. An index intended to capture this construct should correlate with technology-oriented behaviors, including activities performed online, technology products owned and frequency of Internet usage, in order to be valid measurements. The results reveal that all scale formats provide a valid form of measurement though the carousel and scroll features perform slightly better. (Table 2). All scale formats are correlated with the number of tech activities consumers perform (download books online, use Skype, etc.) and technology devices owned, though only the carousel and scroll formats correlate with Internet access frequency.
More thoughtful responses
A high-quality measurement ensures respondents understand what is being measured and leads to more thoughtful responses. Three measurements were examined to evaluate the quality of each scale format: the non-contingent response bias, the average number of item non-responses and the proportion of respondents who straightline their responses.
The non-contingent response test (NCR) provides data on the “tendency to respond to items carelessly, randomly or nonpurposefully.”1 It is measured by collecting opinions of one concept but asking it two ways – one with a positive meaning and one with a negative. For instance, if a respondent “agrees” with both “I enjoy being outdoors” and “I do not enjoy being outdoors,” then they are likely providing inaccurate responses.
Straightliners provide little to no variation in responses to attributes, which would indicate they provided random responses and could potentially result in faulty data. Straightliners are identified by measuring the variance across the scale items of interest. A variance of zero would mean the respondent gave the same answer to all items.
Item non-response is measured as the average number of attributes with a response of “Not sure.” While researchers want respondents to be honest about their lack of knowledge on a topic, we don’t want respondents to answer with “Not sure” due to poor scale placement or some other factor related specifically to the scale.
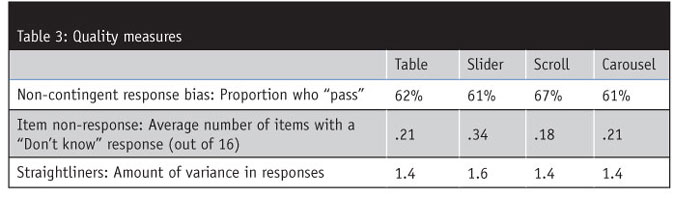
As the results in Table 3 show, there is a slight advantage to using the scroll scale format and a potential disadvantage with the slider scale format. The data suggests that respondents are more likely to respond consistently when attributes are presented with the scroll format in that these respondents are more likely to have the same opinion of the attribute when the wording is reversed.
Though none of the scale formats had a particularly high level of item non-response, these issues are somewhat more prevalent with the slider scale format. However, it is possible that these results were influenced by the lack of visual differentiation of the “Not sure” point in the slider scale and it may have been interpreted as the “strongest level of agreement” because respondents have a tendency to assume the very last point on a scale is the “strongest.”
The level of variance in responses is generally consistent across all scale formats. This suggests that neither format has an advantage or disadvantage in encouraging straightlining.
Has a slight advantage
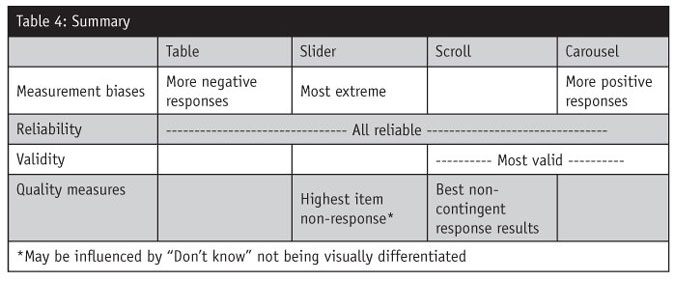
Given the limited amount of variation in the findings, there is not one scale format that provides exceptionally better data in terms of biases, reliability, validity and quality compared to other scale formats, meaning all formats would be acceptable to use during data collection. Nevertheless, the evidence suggests that the scroll format has a slight advantage in validity and in ensuring more consistent responses. The results also show that it is important to differentiate item non-response points on a scale, such as “Not sure” or “Not applicable,” on all scales. Results for the slider scale suggest that respondents potentially confuse a high rating with “Not sure.”
If a researcher is considering changes to an existing tracking study to keep respondents engaged, it is likely that results will change slightly simply by the implementation of a different scale format. For example, transitioning from a table format to a carousel format could generate an artificial improvement in ratings (Table 4).
One of Rockbridge’s tracking study clients was interested in evaluating different scale formats but because there was concern that a changed format would influence results, Rockbridge conducted an experiment where half of the sample received the scaled items in a traditional, radio-button style and half received the items with the carousel feature. Not only was Rockbridge able to confirm suspicions of a change in results but the data could be calibrated to reflect the data collected with the original format.
Online survey research has traditionally been conducted using Internet Explorer but is quickly being superseded by other browsers, including those on mobile devices and mobile apps designed for survey panelists. Given the different technology for non-IE browsers, extensive testing should be done to ensure consistent formatting across all main browsers. Also, a mobile device itself could influence ratings because of factors like the entire scale being compressed to fit smaller screens.
It’s also possible that these findings would change if tested with different types of scales. A five-level, fully-labeled agreement scale was used in the NTRS (with a point for “Not sure”) but results may have differed if a seven-level, partially-labeled scale had been used or if it had different anchors.
Become more prevalent
There are plenty of opportunities to make research surveys more interesting by using a variety of visual components to collect opinions from respondents and these enhancements will become more prevalent as advances are made in survey design technology. As new enhancements are implemented, consideration needs to be taken in evaluating the results, especially if they are applied to existing attribute batteries in a study with a tracking history.
References
1 Baumgartner, Hans and Steenkamp, Jan-Benedict E.M. “Response styles in marketing research: a cross-national investigation.” Journal of Marketing Research: May 2001, Vol. 38, No. 2, pp. 143-156.
2 Chen, Chuansheng, et al. “Response style and cross-cultural comparisons of rating scales among east Asian and North American students.” Psychological Science. May 1995. Web. April 10, 2014.
3 Harzing, A.-W. (2006). “Response styles in cross-national survey research: a 26-country study.” International Journal of Cross-Cultural Management, 6, 243–266.