Editor's note: Amy Hayes is vice president of global brand at Bazaarvoice, Austin, Texas.
“Seasonality” is a powerful word. The regular and predictable changes that recur every year affect everything from animal migrations to fluctuations in the financial markets and, yes, the buying patterns of consumers around the world. For decades, marketers – always attentive to any trend that can help maximize sales – have used purchase data to methodically plan campaigns around holidays, vacation schedules and even television programming.
As it turns out, though, analyzing the historical ups and downs of sales data means that many marketers are likely getting only part of the story. It’s one thing to know when a shopper pulled out his or her credit card but what if you could know when they actually start evaluating what products to buy and what features they care about most? What if you could see how consumers form new shopping habits during peak shopping seasons that create new opportunities for you to engage them throughout the year?
The Conversation Index Volume 7, the latest issue of Bazaarvoice’s semi-annual research series, reveals that online customer conversations expose a great deal about shoppers’ seasonal purchasing behaviors. Based on an analysis of sample data from the Bazaarvoice network, including more than 57 million reviews and upwards of 35 billion product page views, the findings indicate a number of strategies that retailers and brands can employ to capitalize on seasonal trends and maximize sales.
Make-or-break sales period
Around the world, November and December mark the busiest shopping time of the year and a make-or-break sales period for retailers and brands. With holiday gift-giving on the minds of millions of consumers, it should come as no surprise that these two months consistently see more consumers interact more often with online reviews than at any other time of the year.
What may be more of a surprise, though, is how closely the spike in review usage during the holiday season parallels holiday sales. According to the Census Bureau of the U.S. Department of Commerce, U.S. e-commerce sales for the fourth quarter of 2013 totaled an estimated $83.7 billion – a 39 percent increase from the average of e-commerce sales during Q1-Q3 2013. In parallel, review page views for November and December exceeded the monthly average for the rest of the year by 38 percent and 48 percent, respectively.
Drilling down further, data from comScore shows online spending on Black Friday and Cyber Monday reached $1.2 billion and $1.7 billion, respectively – increases of 169 percent and 239 percent over the daily e-commerce average for the first 29 days of November 2013. Likewise, Black Friday and Cyber Monday were the most review-trafficked days of the year, beating the November daily average for review page views by 77 percent and 84 percent, respectively.
Looking internationally, most countries mirror the U.S. in that review usage is highest in November and De-cember, as consumers are researching and buying gifts in preparation for the holidays. However, while Black Friday and Cyber Monday are the most review-trafficked days of the year globally, it may come as a surprise that both days are outperformed by Boxing Day – a bank holiday that generally takes place on December 26th – in the countries that celebrate it.
Similar to Black Friday in the U.S., Boxing Day shoppers rely heavily on consumer feedback to guide their purchase decisions. Across the U.K., Canada, Australia, Hong Kong and South Africa, review page views maintained a relatively steady average of approximately 20 million per day from June-September 2013 before climbing to approximately 30 million per day between October and November. Review page views spiked further – to nearly 40 million on Black Friday and Cyber Monday – and reached a peak of nearly 45 million on Boxing Day. Given the consistent growth in the lead-up to Boxing Day, it may come as no surprise that the IMRG Capgemini e-Retail Sales Index shows that U.K. online retail sales in December recorded 18 percent year-on-year growth as British shoppers spent £11 billion online, while data from Experian Hitwise shows that Boxing Day 2013 was the biggest and busiest day ever for online retailers in the U.K.
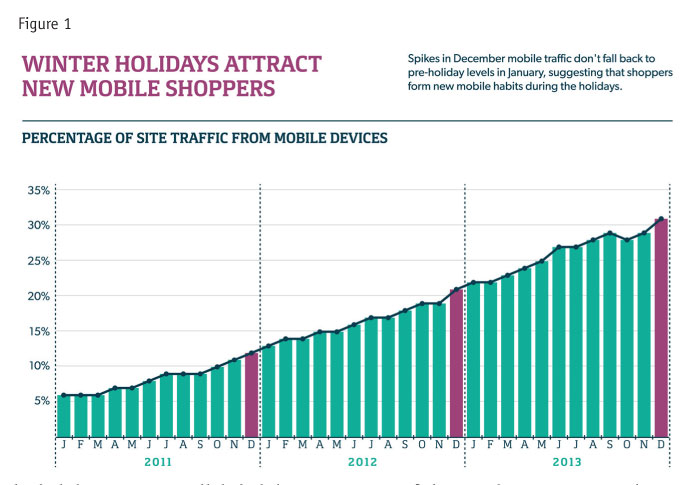
While analyzing consumers’ interaction with online reviews can help predict the relative strength of the holiday season from a sales perspective, understanding how consumers interact with reviews can provide clues to en-gage with them throughout the rest of the year. In particular, mobile traffic to review pages consistently jumps from October to December, then continues to grow – albeit at a more moderate pace – after the new year. The data suggests that many people try mobile shopping for the first time during the holiday season and then be-come mobile shoppers for life – making the holidays an excellent time to win their mobile loyalty (Figure 1).

Moreover, while people are still less likely in general to buy or read reviews via mobile, data shows that the impact of reviews on mobile shoppers is much greater than it is on desktop shoppers. In a desktop-computing environment, review readers are 66 percent more likely to buy than consumers who don’t read reviews. On mo-bile, however, review readers are 127 percent more likely to buy. With nearly double the impact on conversion versus desktop shoppers, reviews should be an essential part of an effective mobile experience.
The back-to-school shopping season
The back-to-school season varies from one country to another but often is viewed by retailers as an opportunity to boost sales during those months when consumers trade trips to the mall for a trip to the beach. In the U.S., the back-to-school shopping season is second only to the end-of-year holidays and retailers and brands in the consumer electronics and office supplies industries ramp up their campaigns accordingly. But do they do it early enough? Data from the 2013 season shows that, if they heeded market research and traditional back-to-school shopping assumptions, they may not have.
Market studies last year asked people when they planned to do their back-to-school research, and respond-ents indicated that research would peak in mid- to late-July.1 However, Web data from customer-written reviews and product questions and answers across consumer electronics and office supplies show differently. In fact, shoppers started researching back-to-school purchases as early as mid-June – approximately the same time as the end of the school year for many students across the U.S. And research peaked in the first week of July – weeks earlier than consumer surveys predicted. The upshot? U.S. retailers who ran back-to-school campaigns stocked with consumer reviews were best prepared to earn shoppers’ sales during the 2013 back-to-school season. Visitors to consumer electronics or office supplier product pages were 37 percent more likely to buy if they interacted with reviews and revenue per visit in these industries increased 28 percent and 48 percent, respectively.
Internationally, back-to-school research more closely matches predictable patterns. For example, students in Australia attend school for 200 days per year from late January to mid-December. Back-to-school research peaks in January, with most Australians accessing consumer reviews and product questions and answers just prior to the commencement of the school year. Similarly, most schools in Japan run on a trimester schedule. The academic year begins in April and ends the following March, with breaks for summer, winter and spring to separate the three terms. Unsurprisingly, Japanese consumers do most of their electronics and office supply research in April. Further reinforcing the rise in research, April also marks a time of year where many professionals traditionally make career changes and precedes the “summer bonus” season when spending increases and many Japanese retailers offer special discounts.
Travel is next on the list
Following the end-of-year holidays and back-to-school season, travel is often next on the list of many consumers’ main outlets for discretionary spending. Travel and tourism represents one of the world’s largest industries and, according to the United Nations World Tourism Organization, travelers worldwide spent an estimated $1.2 trillion in 20132 on accommodations, food and drink, entertainment, shopping and other services and goods. The average travel review on the Bazaarvoice network is 60 percent longer than reviews for all other categories.
Travel reviews are also highly seasonal, with submissions skewed heavily toward June, July and August (Figure 2). That’s to be expected but, following the trends, we see that some sorts of travel are more seasonal than others. For example, review submission data shows that pleasure travel booms in April and stays high through September, dropping off from October-March. Family travel shows a sharper spike between June and August, when the kids are out of school.
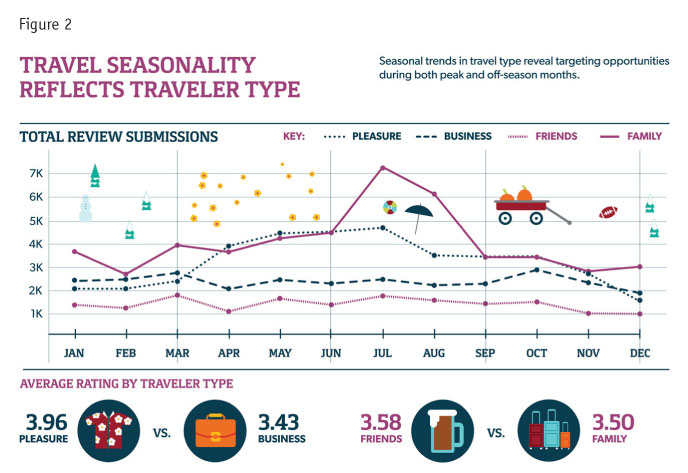
Analysis of the review text shows that positive reviews from all types of travelers most often mention the des-tination’s location, breakfast and the friendliness of the staff. However, seasonal trends reveal when to target different types of travelers and what amenities should receive special attention to avoid negative feedback:
• Target your marketing messages to families and pleasure travelers in the peak season from April-September and look for opportunities to improve areas that most often cause these travelers to write negative reviews: water temperature and pressure; small rooms and pool; cigarette smoke; and street noise.
• Switch your marketing focus to friends and business travelers in the off-peak times from October-March. Hoteliers that cater to business travelers should emphasize high-quality Internet service and fitness rooms, while travelers with friends are sensitive to the quality of the sofa bed, A/C and bathrooms.
Drive full-margin sales
Seasonality plays an important role in marketing for any company but a better understanding of when you can best engage consumers may pay off in ways beyond just grabbing their attention. Consider that, as the holiday shopping calendar ticks closer to Christmas day, companies increasingly boost discount offers and run free shipping promotions, followed by clearance prices in the days and weeks after December 25. Leveraging the data in reviews to charge-up off-season shopping can help promote business during those periods when sales are less common, helping to drive full-margin sales. And, as the data clearly shows, an emphasis on reviews helps maximize efforts for those times of the year when you know things are about to pick up.
Companies around the globe are using the consumer feedback in online reviews to inform their business operations, from identifying ways to improve customer service to discovering the product refinements that can promote brand loyalty. Any company that is capturing online reviews should be analyzing them to understand the what and why behind consumers’ experiences with the brand’s products and services. But reviews can also help illuminate the when and how trends in online shopping and can be a key to success when targeting new markets – and winning new customers year round.
REFERENCES
1Stolt, Jacalyn. “Trending for back to school: One Direction and dorm room chandeliers.” Google Shopping Blog. July, 2013. http://googleshopping.blogspot.com/2013/07/trending-for-back-to-school-one.html
2“International tourism generates US$1.4 trillion in export earnings,” UNWTO, May 14, 2014. http://media.unwto.org/press-release/2014-05-13/international-tourism-generates-us-14-trillion-export-earnings