Editor’s note: Joel Rubinson is the president and founder of Rubinson Partners, a New York marketing research consulting company.
Marketers and media companies are always looking for an edge. In this case, many are placing great attention on second-screen behaviors – that is, the behavior of someone watching TV while using a second-screen device. The desired edge comes from engagement: if a viewer is so into a TV show that they are looking up actors, answering synchronized quizzes and tweeting about the show, it creates the possibility for drawing more attention to a commercial that is running on TV and perhaps being reinforced in some way on the second screen. That makes the commercial more valuable to the advertiser and therefore would command an additional premium to the cost of the advertising. This premium was notable for the last episode of Breaking Bad, which commanded $300,000-$400,000 for a 30-second spot and in fact, received nearly 10 times the activity on Twitter vs. any other show that week.
However, it is unclear if marketers, agencies and media really know how much multitasking goes on and if the second-screen activity is in any way related to the show that is being viewed. As such, there is strong interest among content producers, distributors/providers and advertisers in better understanding audience behavior given the multitude of screens easily available to most U.S. consumers today.
A recent study designed by Rubinson Partners and using CivicScience, a Pittsburgh-based research firm, sheds light on the relationship between TV viewing and digital devices from the consumer audience perspective.
Multi-screen behaviors study
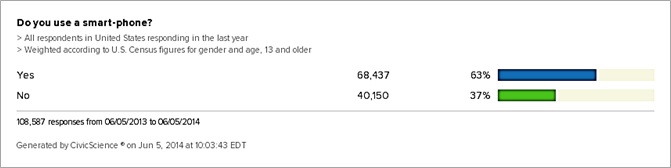
Let’s start with adoption levels for second screen devices. The majority of U.S. consumer respondents (63 percent) own a smartphone:

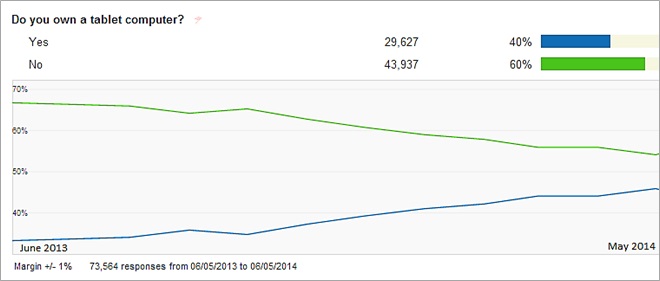
And ownership of tablets among U.S. consumers has been steadily rising over the last 12 months, with current adoption levels at 40 percent:
We used the CivicScience consumer research platform, where respondents voluntarily answer a series of three polling questions on a Web site but many continue to answer more questions and be repeat respondents. All question results are maintained in a database so that results can be accessed and crosstabbed.
Responses to the primary poll question for this study were collected from May 21, 2014 to June 3, 2014. These responses were weighted for U.S. Census representativeness by gender and age, 13 years and older. Approximately 95 percent of respondents were U.S.-based. Respondents were crosstabulated against other questions they have previously answered. (A minimum of 1,000 combined responses to any crosstabbed questions were required to be included in this analysis.) We posed the following question to voluntary, anonymous consumer participants, so that we could analyze more closely the dynamic between TV show viewing and these second screens:
While you are watching your favorite shows or movies on TV, which best describes what you are doing with your smartphone, tablet or laptop? (i.e., your "second screen")
• Nothing, those devices are put away
• I’m reading and/or posting about the show on social media
• I’m viewing mobile apps, games or content related to the show
• I’m viewing mobile apps, games or content NOT related to the show
• I’m checking e-mail or texting
• I watch my shows on such a device, not on a TV
• I don’t own any of these devices
• I don’t watch TV
We received data from 7,409 respondents. We eliminated those who don’t watch TV, leaving 7,029 respondents for us to review. Here are the topline results:
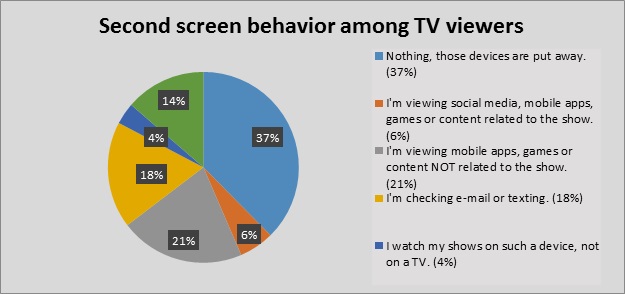
Source: CivicScience Inc. 7,028 respondents, weighted for U.S. Census representativeness for gender and age, 13 and older. Report date: 6/3/2014.
• Nearly half (45 percent) of TV watchers are multitasking with a second screen device. Thirty-seven percent of TV watchers put their devices away and 14 percent don’t own such devices.
• Only about 4 percent are using their mobile devices as a complete replacement for the big box for viewing TV content.
Of those who ARE using their devices while watching TV (3,427 respondents):
• Eighty percent of them are distracted: they are checking e-mail, texting or interacting with Web sites or apps that are unrelated to the show they are watching on TV.
• Twelve percent of them are engaged with the show’s content, with 64 percent of those engaged via social media and the rest interacting with apps or Web site content related to the show.
• The remaining are replacing the TV content and watching on these devices.
When we look at the behaviors by age group, we see that most viewers are engaged at the same rate (roughly 2 percent) with show-related Web sites and games, while the younger viewers, aged 13 to 24, are much more likely to be interacting about the show on social sites:
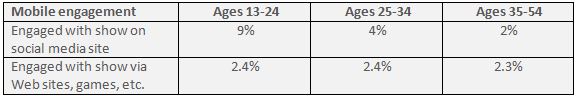
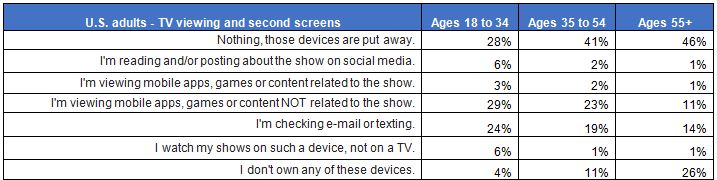
Another way to look at the age groupings is by adults only, which shows the very clear second-screen engagement distinction between Millennials and older age groups:
Benefits to advertising
Second-screen activity is pervasive; however, 80 percent or so of it is unrelated to the TV show that is being watched. This suggests that coordinating advertising across screens via related content is not yet at scale. However, there are other opportunities that are afforded by unrelated second-screen activity that should not be ignored. For advertisers there is the opportunity to precisely time their digital ads on unrelated sites with TV commercials via programmatic buying. As an example, I might be watching America’s Got Talent and reading news on Huffington Post at the same time. The advertiser could programmatically trigger a digital ad timed exactly with the commercial airing.
A second application for marketing researchers is also interesting. If a media company wants to understand how people are reacting to a given episode, one can imagine launching a survey at exactly the right time to get in-the-moment feedback, knowing that half or more of viewers have a digital screen in front of them.