Back to the future
Editor's note: Eric Whipkey is assistant manager, member satisfaction and experience metrics, member research and intelligence division, at Navy Federal Credit Union, Vienna, Va. This is an edited version of the article that originally appeared in the March 2016 issue. It contains post-publication alterations made at the request of the author.
Big data is here and the survey is going the way of the dinosaur – or so says the business press as well as many researchers on both the client and the supply side. Despite all the dystopian tales of the future of research, when it comes to member experience measurement and tracking there is still room for an old-school blended research approach (qualitative followed by quantitative).
Since 1933, Vienna, Va.-based Navy Federal Credit Union (NFCU) has grown from seven members to over 6 million members. It provides financial products and services to a unique field of membership including those serving the military and their families. I recently completed a total revamping of NFCU’s corporate satisfaction/experience survey and channel-focused transactional experience surveys. Basically, the legacy corporate satisfaction survey had many individual questions and attributes. Based on R2s associated with the key drivers from that study (and client questions), we wondered whether we were asking the right questions.
We are fortunate to have a stable of strong qualitative researchers and we decided to undertake a realignment study starting with a robust set of focus groups. Our qualitative research explored the meaning of some of the known key drivers and illuminated new areas of focus. Since we knew that the existing key drivers were important to the member experience, we asked members what these meant to them. There were seven dimensions developed based on these key drivers. We will refer to these dimensions throughout this article as Dimension 1, Dimension 2, etc.
After developing a very comprehensive list of potential new survey items based on the outcomes from the first two focus group locations, we moved on to the next market for a few more groups. We tested these new items with these groups to ensure they were on target and in the members’ words. The result was a robust set of seven survey dimensions (groups of questions) that described the member experience. These were later narrowed down from 50 new attributes to closer to 40 attributes.
Focus groups were followed by a three-month pilot test during which we utilized reliability analysis (Cronbach’s alpha) and factor analysis to reveal three separate dimensions around the construct of “making things easy.” These three dimensions were totally new concepts that had not been part of the survey in the past. Further factor analytic techniques also confirmed that three other dimensions fit together into one primary con-struct that we called “doing things right.”
In the end, the survey was decreased from 40 to 26 attribuets for the full survey. After the second pilot month, we were able to reduce the number of survey questions per dimension to a total of 26 dimension-based attributes.
The final dimensions were formulated using both exploratory and confirmatory factor analysis and included “doing things right” (four dimensions) and “ease of doing business” (three dimensions).
We did have some external assistance with this part of the work. Our research partner ran the confirmatory factor analyses and a structural equation model (SEM) using Mplus. It was a rather painstaking, iterative process but it was worth it to get to a concise model that was both intuitive and easy to explain to leadership.
After finalizing this more streamlined survey, we have collected a full year’s worth of monthly data, which now also includes channel- and product-based satisfaction ratings. We have since finalized the SEM and identified one clear path to “strong member experiences.” During our survey development process, we also managed to add new KPIs, focused on “ease of doing business” and “switching” and proxies for most components of the predominant secondary research satisfaction and experience frameworks that we were tracking or planning to track.
In the end, our corporate satisfaction model tells a nice simple story, despite its inherent complexity and the layered insights it provides. We find that to engender satisfaction, advocacy and perceptions of comparative ease of doing business, it is important to do three basic things, in this order: do things right, make things easy and provide products and services in the right format (i.e., channels and products).
Connecting it to the brand research
The price of entry appears to be a strong perception that your organization properly supports your “prime target demographic” or your core constituency. This is consistent with the idea that your brand must act in a manner consistent with your target’s expectations and needs. As we build this model out further, I envision connecting it to the brand research via some additional modeling work. At present, the model allows drilling down into the measured domains to better understand what is behind each concept and how members with different product/channel usage patterns respond.
In one example, we find that the less engaged a member is, the less satisfied they are across core model drivers, yet all follow the same path to satisfaction, advocacy and perceived ease of doing business. Having great channels and products will only get you so far in terms of loyalty, advocacy and measuring up to other organizations. First you must treat members right and provide them with processes/services that are easy to use, work with or get value from. Then they can best use the channels and appreciate the products and services. The beauty of this type of research is that we can really dig deep with the data we have to understand how to do all of these things. I have only gone two layers deep here but one can easily go further.
While we were building that corporate model, we also began exploring how this same model could work at the channel level (call-center and branch). The study started with our contact center and branch experience surveys. Like the general member satisfaction survey, these had been in place for some time and both consisted of individual attributes. Following the same approach described above, we looked at the existing survey and the current satisfaction drivers and asked: What might these mean from the perspective of members? What more might there be to these attributes? How might these differ in the context of the delivery channel (contact center, branch, retail store, online, mobile, etc.)?
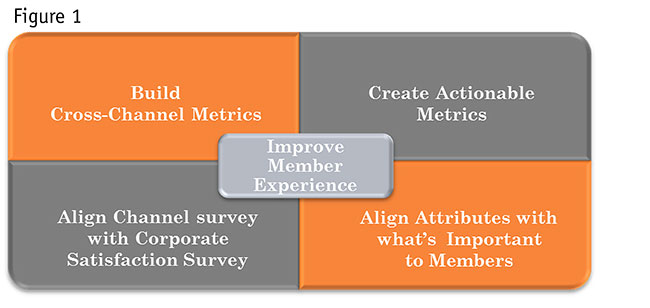
We then asked our members in a series of focus groups and found that two of the dimensions were not relevant and one needed a name change. In addition, some of the attributes making up those dimensions needed to change slightly to be put into context but the core dimensions were the same. We discovered that we could track several layers of cross-channel information, including KPIs – some attributes relating across channels – as well as tracking the experience based on dimensions. At this point, we have taken what we learned from our members and crafted channel surveys which are now being piloted. Initial results are pointing to surveys with similarly-structured dimensions that will easily allow for cross-channel measurement across no more than 20 attributes. Thus we are set to have cross-channel metrics that are aligned with our corporate satisfaction measure, have attributes aligned with members’ needs and provide actionable metrics that will help to improve member experiences (Figure 1).

Did take a long time
Yes, this did take a long time, especially considering the delays that were necessary as we socialized and gained approvals for the piloting of the new channel surveys. Keep in mind that all of these surveys required tracking in parallel with the old survey, which we were hoping to replace.
Replacing a measurement infrastructure takes time. We are being careful to ensure that the model is stable and significantly robust before we formally roll it out. As anyone who has ever been involved with tracking research knows, change needs to be introduced slowly and be carefully socialized. We are in the process of weaning our stakeholders off of that old tracking.
Working up to this point, we infused insights from the focus groups and later the survey development into targeted quarterly reports with the promise of new data to come. At the time of this writing we are now one month into our plan to field these new surveys in parallel for three months. Just as we did with the corporate satisfaction survey, we will use the collected data to apply factor analytic and reliability analyses (coefficient alpha) to win-now the number of questions per dimensions to no more than three or four. This should leave us with two short surveys of no more than five minutes in length. Following this pilot phase, we will finally be able to pull the plug on the old surveys and unveil the more robust new cross-channel metrics and dimensions.
I realize that the time needed to do this “old-school research” is one of the basic criticisms leveled against traditional research by the big data branch of our industry. I tend to agree that research does need to recognize the need to balance fidelity with time to complete. Our employers and/or clients are, after all, looking for quick results so that they can respond to market disruption and/or rising member expectations while maintaining a business advantage.
So yes, big data, agile research and other quick-to-the-boardroom approaches can actually help us to respond to the C-suite and/or speed up the innovation pipeline. In essence, these new techniques can buy us the time that we need to carry out these more thoughtful approaches and ask the questions that still need to be asked. Yes, we do still need to ask and listen to members. After all, the old-school research techniques are still best-suited to identifying the targeted needs (the whys) of members so that organizations can make the strategic moves needed to ensure stellar member experiences.
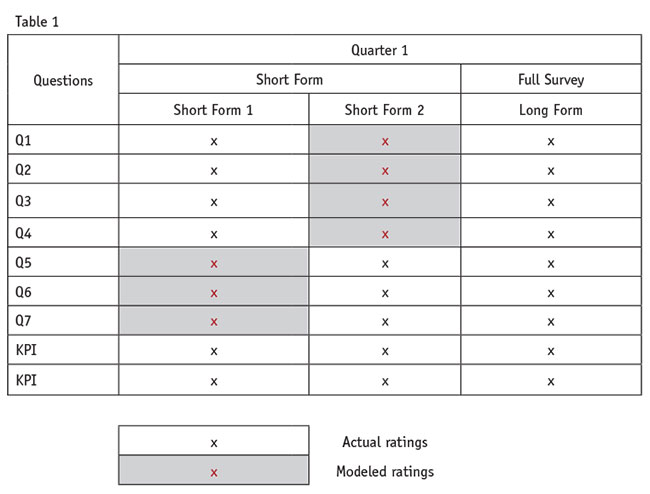
Likewise, data-modeling approaches can help these traditional surveys to be easier for respondents and quicker to field as well. For example, even as we field and finalize the contact center and branch surveys, we are still working to make the corporate satisfaction survey shorter without losing the power to reveal insights and improvements. We are exploring a new missing-data modeling approach that will allow us to field our monthly corporate satisfaction survey and eventually the channel surveys in short and long forms. With this process (Table 1), we will field the corporate satisfaction survey with one question from each of the seven core dimensions and our KPIs (an approximately 10-item survey). This short form will be rotated throughout each quarter with one fielding per quarter of the long-form or full survey (four times per year). Our research partner will then model the likely ratings for all questions, reconstructing our dimensions across each survey month.
What we lose in fidelity in the short-form months we should gain in response rates, slower burn rates on our survey universe and making better use of our survey tools.
Many things are changing
To me, we are in a time in market research where many things are changing but many other things are staying the same. I was on a call with a researcher from Forrester Research not long ago. She was researching the uptake rate of many of the new next- gen approaches. While she was finding many new angles on things like emotion research – one of the components of our survey model – there were still few actual client-side takers. Clients just are not finding this other stuff (facial recognition, implicit measurement, neuromarketing, etc.) to be easy to sell into their organizations and they are getting good, useful results with their existing approaches – surveys and text analytics (for sentiment).
That is where we are too, though I am happy to use the new stuff. Take for example what we are planning for the missing-data modeling. That has a lot of value in our organization and it is a pretty easy sell – as long as it does not sully our data quality.
The sci-fi stuff is just not there yet but I hope it soon will be. It sure looks like fun.