
Editor's note: Jyanping Rung is a principal/VP of advanced analytics at Chicago-based research firm IRI.
Product line management is a core component of marketing management. Product manufacturers and service providers need to plan their product portfolios properly to engage more of their customers and minimize product cannibalization in competitive settings. Sales data is often used for this end. However, when a new product concept or product line extension is under consideration, survey approaches such as total unduplicated reach and frequency (TURF) 1 2 usually fill in. TURF can handle a long list of product items for retail product assortment or for a manufacturer’s retail communications but it does not capture product trade-offs for a deeper understanding of why.
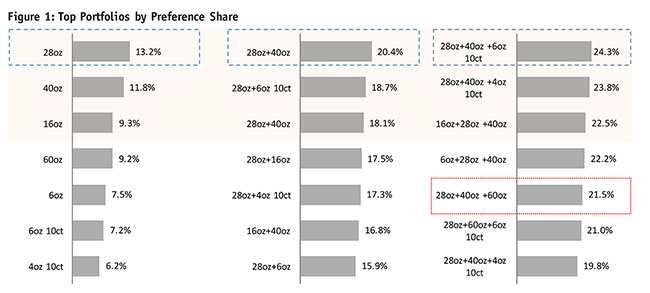
In a food-category study, we adopted discrete choice modeling and simulations for portfolio optimization with an understanding of product trade-off and substitutability structure, along with pricing. We aimed to explore pack portfolio and pricing opportunities for Brand A. In the market there were five major brands. Seven packs of Brand A were included in the study. Our objective is to identify optimal portfolios with three packs of Brand A in comparison to the current portfolio. The discrete choice modeling and simulation results show (in Figure 1) that both the portfolio of 28-ounce, 40-ounce and multi-pack 6-ounce 10-counts and portfolio of 28-ounce, 40-ounce and multi-pack 4-ounce 10-counts outperform the current portfolio of 28-ounce, 40-ounce and 60-ounce. The 28-ounce pack alone reaches the most buyers while 28-ounce and 40-ounce forms the strongest two-product portfolio. The optimizations can go beyond three products.
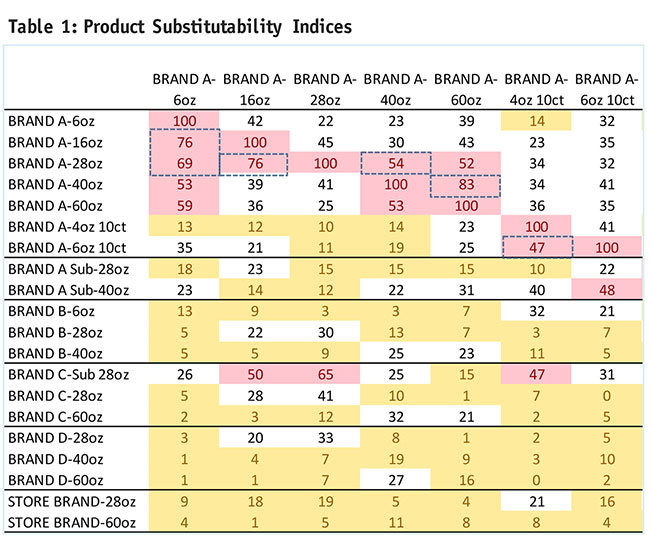
To better understand the portfolio simulation results, we investigated product substitutability structure and generated the product substitutability indices from discrete choice modeling results. As shown in Table 1, each index (ranged from 0-100) is the percent of buyers who favor the product in the column also favor the product in the row. For example, 76 percent of buyers who favor Brand A 16-ounce also favor Brand A 28-ounce, which means we may need only one of these two packs. Brand A 28-ounce, Brand A 40-ounce and Brand A 6-ounce 10-count packs are the least substitutable to each other and therefore attract the most unique needs among the three pack portfolios. Brand A 16-ounce is substitutable with Brand A 28-ounce. Brand A 60-ounce is highly substitutable with Brand A 40-ounce. Brand A 6-ounce pack is highly substitutable with Brand A 16-ounce and 28-ounce multi-packs; 6-ounce 10-counts and 4-ounce 10-counts are also substitutable.
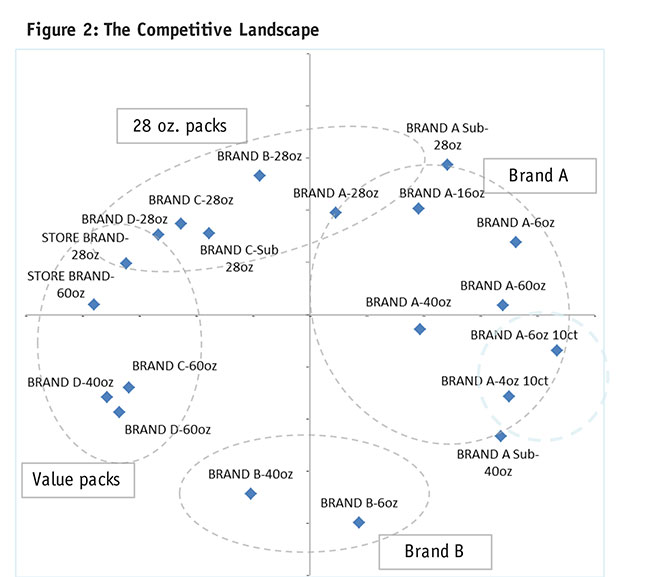
From the indices table including all the products, we mapped the products in the competition market landscape (Figure 2). Four distinct product groups are observed by substitutability: 28-ounce packs, value packs, Brand A packs and Brand B packs. Brand A 28-ounce primarily competes with Brand B 28-ounce, Brand C sub-28-ounce and Brand A 16-ounce. Brand A 40-ounce primarily competes with Brand A products, Brand B 40-ounce and Brand C 60-ounce. Brand A is positioned separately from store brands/value offers. Brand A multipacks capture some unique needs at the lower-right corner.
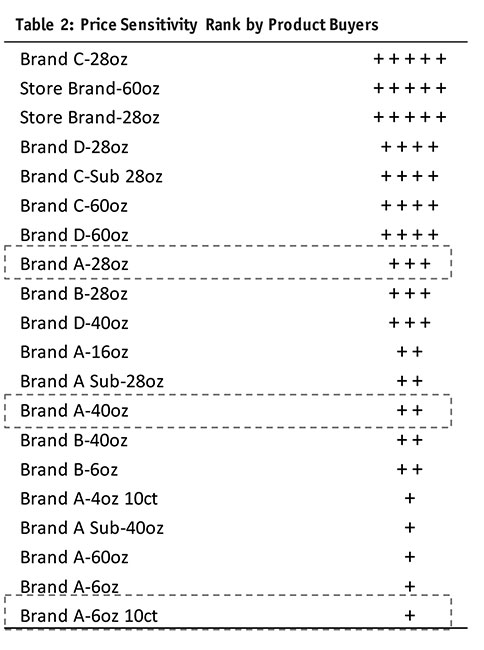
To form general guidelines for pricing strategy with the optimal portfolio, we measured and ranked price sensitivity from high to low by product buyers as in Table 2 ( +++++ = highest price sensitivity; +++ = moderate price sensitivity; + = lowest price sensitivity). Store-brand and Brand C buyers are most price-driven, followed by Brand D buyers. Brand A multipack 6-ounce 10-count buyers are least price-driven, given the only multi-pack option available. Among Brand A buyers, 28-ounce buyers are most price-driven, so the manufacturer may further leverage price/promotions primarily through Brand A 28-ounce, while maintaining its premium position. More simulations are needed to test what-if pricing scenarios and to pinpoint the optimal price or promotion opportunities.
Used for a long while
Conjoint and discrete choice modeling evaluate customers’ product and service preferences and have been used for a long while for customer segmentation, product and service development, price/promotion opportunities and portfolio optimization. Illustrated here is an example for an extended application of discrete choice modeling for market structure understanding based on product and service substitutability.
REFERENCES
1Cohen, E. “TURF analysis.” Quirk’s Marketing Research Review, June 1993.
2Thomas J. Adler, Colin Smith and Jeffrey Dumont. “Optimizing product portfolios using discrete choice modeling and TURF.” Proceedings from the Inaugural International Choice Modelling Conference 2010, pp. 485-497.