Harry F. Krueckeberg is professor of marketing, Colorado State University, Fort Collins . Co., and president of Hark Marketing Management, Inc., Fort Collins . He does extensive work in marketing research and market plan development.
Who would believe that a researcher could be on the leading edge of marketing research with two eyes, one pencil and a ream of paper? Presumably a person on the leading edge of technology in marketing research would have to have two million bytes, one programmer and a ream of dollars.
But not only have qualitative research procedures made it back to the big time during the past few years, now even the eyeball is being recognized again as a substitute for the electronic scanner. What justifies the use of observation in an electronic age? Of what value can observation data be to the marketing planner?
The bag of qualitative research tools contains several frequently used methods, including the focus group session, projective techniques and observation, all procedures which are useful in generating data for management decision making. The goals of this article are: to develop an awareness of observation as a research tool; to improve the level of skill in implementing observation; and to demonstrate its value for management information development.
To meet these goals, I will describe:
- how to perform customer observation research,
- the procedure’s strengths and weaknesses, and
- the information and other benefits that observation can provide a business enterprise.
To illustrate, I will use a customer observation scenario in which 100 customers were observed in one retail food store dairy department over a 30 day period.
Observation defined
Observation is a means of describing the actions customers take in a realistic situation. More importantly, observation research data can assist in the effective planning of marketing strategies and in the monitoring of strategic marketing decisions.
It can shed light on questions such as: What can be done to enhance the sales of a product or a retail store department? What factors are apparently deterring the customer from making a decision to purchase an item? What important and feasible decisions can be made to enhance the customer’s shopping trip?
Observation procedures involve:
- Using observers trained to recognize shopper characteristics such as dress and age.
- Using unobtrusive markers in aisles and on display cases, to make sure distinct locations can be recognized.
- Requiring observers to be familiar with all displays, product placement and other meaningful locations which can easily be identified.
- Making sure that displays and other characteristics of the location remain consistent during the project—holding off changes until the project is complete.
- Monitoring each observer to identify any specific tendencies by an observer, such as the observation of males more often than females.
- Close adherence to the form used for recording observations.
- Debriefing observers periodically (daily if possible) for any unusual occurrences they have observed or heard that might have influenced the observations they were making.
Observation involves several alternative techniques. The project described in this article involved the following:
- The observations were conducted in a natural store setting and shopping situation (versus a reactive or artificial setting).
- The observer was unobtrusive and maintained a very passive role (versus taking an obtrusive, active role).
- The observation was structured—a prescribed set of actions and characteristics were to be observed and recorded (versus an unstructured technique).
- Data were the result of direct observation (versus indirect) by a human observer (versus a mechanical one).
Observation justified
Observation can be justified in terms of time and cost. Retail food store management needs and wants to conduct research in a timely and effective fashion, and while there are advantages to simplifying the collection of research data, there is also a need to maintain a level of validity in the research results.
Employees can be trained to conduct observation research. Depending on the intended use of the data, sophisticated analysis or simple tallies can be made. The investment of time and money is worthwhile because each observation can provide valuable information which management can use to determine shopping patterns, describe shoppers, profile market segments, and gain insight into the effectiveness of store layout, advertising and promotional strategies.
What observation can provide
Observation can be used to reinforce, monitor and or modify three broad strategic marketing decisions by retail store managers. These decisions involve the:
- improvement of facilities such as aisle width and display location;
- elimination or reduction of barriers to customer transactions, such as stocking carts and special displays that are dangerous or too high; and
- identification and description of customer market segments, such as males, females, shopping cart users, etc.
Observation is also a means of establishing communication with the customer. In retail food stores, customers react to many factors, such as price, quality, and service. Their reactions, which can be recorded by observation, “communicate” a great deal to store management. And in turn, management can communicate with the customers by reacting to their observed actions.
Strengths of the observation method
The strength of observation lies in what it is: a detailed record of actions taken by persons in a realistic setting. It can be a complete record of actions taken during a period of time.
Observation data are not a result of recall and interpretation. The person observed is not required to recall actions by answering a questionnaire or completing a personal interview. Likewise, the observer is not in a position to interpret a response by an interviewee. Action is recorded, not interpretation.
The process of observing, the recording of observable actions, the data processing, and the analysis each individually and all collectively create potential for management information development.
Some people feel that a method that generates action data exclusively is methodologically weak. This reflects excessive expectations of the method and an attempt to stretch the capabilities of observation as a research method.
Do not attempt to create more information or greater value of the information than is valid.
One of the weaknesses often referred to is the inability to explain the cause or reason for an action taken. This is not the intent of observation. Explanation can be determined through a personal interview. An interview could be performed upon completion of the observation without compromising the observed data. Unanswered questions can be resolved directly.
Do not attempt to conclude anything about the motives or intentions of the persons observed.
Observation data can be biased, just as any other data can be biased, if unacceptable procedures are used to carry out the observation method. Bias is minimized by providing every moment of a time frame and every unit of the customer population equal access to the observer. As applied to a supermarket, if a department is being observed, all shoppers during shopping hours should have an equal chance of being observed.
Do not attempt to project the data to the total store clientele unless a probability sample of customers has been observed.
Likewise, it is difficult to control variables involved in comparable situations, i.e., two stores or two different time periods.
Regarding results
The scenario used in this article reflects some of the actions of retail food store customers and indicates how they shopped one store’s dairy department. The physical and demographic characteristics of the customers were observed along with their shopping actions. This data enabled the description and the development of associations between characteristics and actions.
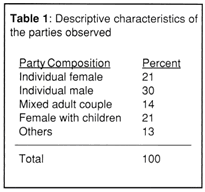
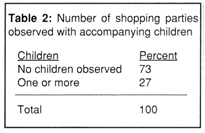
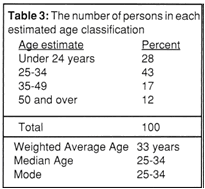
1. Market segment profiles were identified and described using characteristics and actions. 2. Similarities and differences between and among market segments were observable and determinable.
Implications for marketing are logical results of observation. For example, the level of use of a shopping list and a shopping cart indicate that management could take possible marketing actions. The clustered location of product selection instances implies possible improvements in product relocation. In addition, the results imply that departmental efficiency and productivity could be improved in certain areas.
Are the implications correct? Making the improvements and monitoring the results through observation will provide the necessary follow up.
In addition, market segment influences on product selection can be determined. This type of data presents implications and points to conclusions regarding advertising strategies and product promotion.
Observing the customer
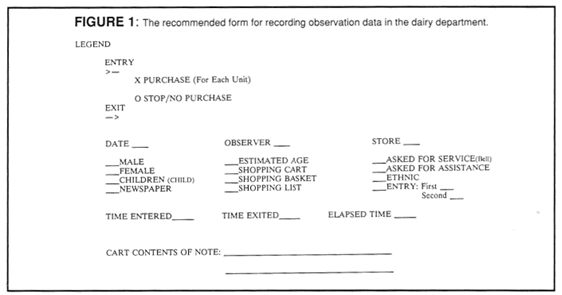
A permanent record was generated during the observation of each shopper (Figure I). Using a clip board and a standard form for each observation did not detract from the unobtrusive nature of the observation. The record controlled the prerogatives that the observer had in recording observations. All actions and characteristics to be observed were prescribed (a structured observation) and recorded directly on the form provided. Shoppers were randomly “picked up” by the observer at either end of the dairy department or in mid-department. Customers were observed regardless of whether or not interest in dairy was apparent or whether they seemed to only be passing through. All persons, once picked up, were observed, documented and included in the analysis even if no purchase was made.

A note of interest: The interpretation of the observations should be influenced by several situational factors noted during the observation process.
The following situations should be noted:
- Weather (rain, snow, etc.)
- Location of store
- Street or construction obstructions
- Time of week (end of the week)
- Time of month (payday, etc.)
- Time of year (holidays, etc.)
What can you observe?
Observation can result in quite a list of results. Given a computer and a little imagination, the list of beneficial information can be quite long.
The results include such information as:
- A description of the individuals observed.
- Customer traffic patterns; department ingress and egress.
- Profiles of the distribution of purchases and product inspections horizontally and vertically in the display cases.
- Number of sections of display equipment from which purchases were made.
- Number of sections which were shopped but from which no items were selected.
- The shelves from which items were selected.
- Relationships of customer characteristics and the location of a purchase in the display case.
- Implications for improvements in a) Facility arrangements b) Barriers to buying products c) Customer satisfaction.
- A description of the shoppers, such as: sex, estimated age, mix of adults, mix of adults and children, ethnicity.
- The use of shopping aids such as: the newspaper, coupons, a shopping cart, a shopping basket, a shopping list.
- Requests for assistance such as: asked for service—rang bell, asked for assistance of employee nearby, went to back room for product or service.
- Other shopping characteristics: number of items purchased, number of items inspected but not purchased, amount of time spent in the department, shopping cart content, time of day.
- Employee interactions with: customers, other employees.
Tables 1, 2, and 3 illustrate three of the ways that the 100 observed parties were described: party composition, number of children, and estimated age of the primary shopper. The customer characteristics were determined for descriptive purposes and for association with product selection actions.
Customer traffic patterns
Customer traffic patterns imply possible improvements in store layout, department layout and product shelf placement. Figure 2 reflects the distribution of stops throughout the department as well as the ingress and egress pattern of the observed customers.
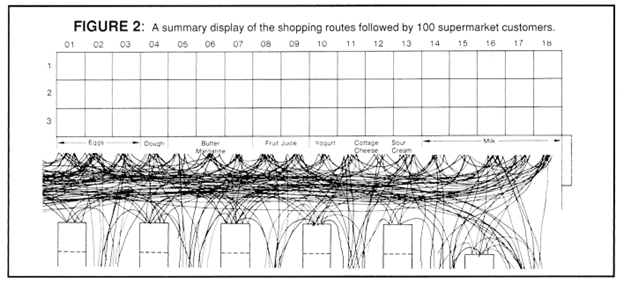
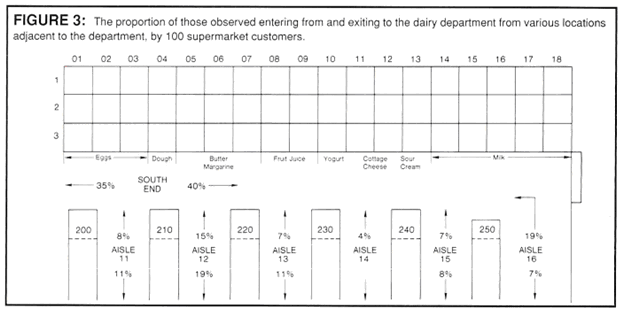
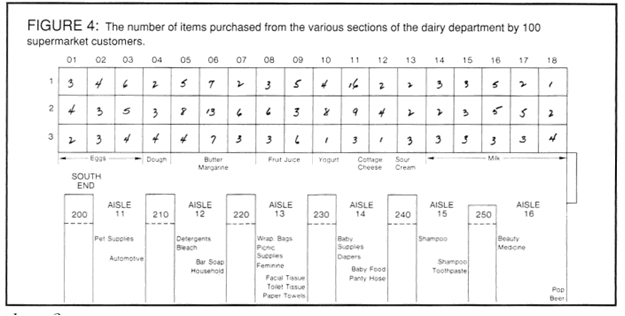
Figure 3 illustrates more precisely where customers entered and exited the department. Depending on management’s objectives, this flow may be satisfactory. But, obviously few customers traveled the entire length of the dairy department. The number of units purchased and the location of the purchase are presented in Figure 4. Several “hot” or busy sections and shelves can be determined from Figure 4. Do these locations demand a disproportionate amount of employee restocking? Do these locations realize an abnormal rate of out-of-stock?
Ingress and egress characteristics
The placement of products in a department influences the route to and through a department. The route will be influenced by the customer’s planned next purchase, a knowledge of the items next in the shopping sequence, and other factors.
No predominant pattern was established. Forty (40) percent ingressed from the south end, following the periphery of the store, but seven percent egressed along the periphery (Figure 3). Forty-one (41) percent ingressed the dairy department from mid-department aisles.
Persons entering the department from a mid-department aisle shopped an average of nine sections of the dairy case while those entering from either end shopped an average of 14 sections.
Persons ingressing from the south end purchased an average of 3.1 units of product while those ingressing from the north end purchased an average of 1.5 units.
Distribution of purchases
Figure 5 illustrates the locations where shoppers just looked at products in the department. The data reveal a disproportionate distribution of “just browsing” instances compared to purchases observed in Figure 4. Are product turns too slow in the high browsing sections? Should product be redistributed to other locations to spread potential impulse purchases?
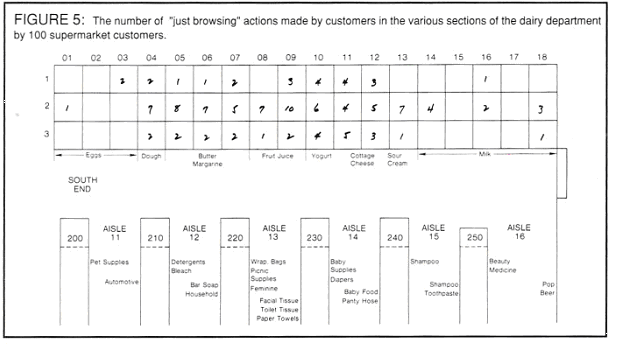
Analysis revealed that there was not a significant variation in the distribution of purchases among the sections of the dairy department, though there was a significant variation in the location of browsing by customers.
Browsing occurred in the mid-section of the department, in sections containing predominantly impulse items rather than staple or high demand items.
The implications for communication strategies are at least three-fold. First, specials and coupons might reduce “looks” and increase purchases. Second, more advertising and promotion may increase awareness of the items and improve attitudes toward these products. Third, in-store demonstrations may reduce looking, and increase purchases.
An analysis of customer traffic patterns will assist store managers in making improvements in product movement and customer purchases. Relocating impulse items among demand items may increase sales.
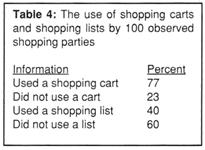
Use of shopping carts and lists
The extensive use of a shopping cart (Table 4) implies a potential for increased unit purchases when compared to the results of using a shopping basket or no carrying device of any kind. This information, coupled with the lack of a shopping list, implies a potential for impulse selling.
Additional information can be observed regarding the use of shopping aids. For example, monitoring the use of coupons and/or a newspaper, and requests for customer assistance can provide information useful in improving advertising, promotion, and customer service.
Customer characteristics and product selection
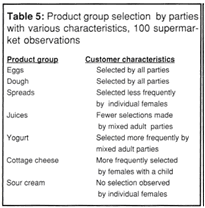
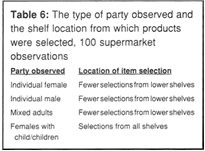
Customer characteristics can be associated with the types of products selected (Table 5) and the location of product selection. Can product selection be influenced by product relocation? Relating Tables 5 and 6, for example, would suggest that the location of eggs is satisfactory in the store involved—eggs were selected by all parties. Without debating cause and effect, one might suggest moving spreads that are particularly appealing to females to a middle shelf to take the pressure off lower or higher shelves.
Shopping and action profiles
The analysis resulted in a description of various “Target Market Profiles.” These profiles were developed to answer a basic question: What actions and shopping characteristics distinguished one market segment from another?
Profiles of two market segments observed are illustrated. These profiles permit a manager to determine the relationship between shoppers and their observed actions.
Individual Female
- Accounted for 21 percent of the parties observed.
- 71 percent used a shopping cart.
- 33 percent used a shopping list.
- 38 percent shopped in the morning and early afternoon and 38 percent shopped after 5 p.m.
- Estimated average age, 35.7 years.
- Purchased an average of 1.68 units of products.
Shopping Cart Users
- 77 percent of those observed used a shopping cart.
- The most frequent cart users were females with at least one child; 27 percent of all users.
- 51 percent observed using a shopping cart also used a shopping list.
- A greater percent of persons (from 67 percent to 83 percent) used shopping carts as the time of day became later.
- 35 percent of those who used a shopping cart were observed with at least one child.
- 43 percent of cart users were age 25–34 years old.
- The most infrequent cart users were individual males.
- Purchased an average of 3.2 units.
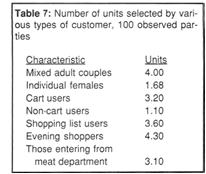
Table 7 reflects the rate that various market segments selected units of product. This information raises several questions:
- Can the number of units selected be increased by influencing the ingress position of customers?
- What can be done to attract more:
- Evening shoppers?
- Mixed adult couples?
- What can be done to encourage more:
- Shopping list use?
- Shopping cart use?
- What can be done to increase the number of units selected by:
- Individual female shoppers?
- Non-cart users?
And finally....
Observation documents customers’ actions which can communicate alternative improvements in management and market planning. Observation enables changes to be made which can improve the shopping environment for both customers and employees. Once the changes are made, it is important to follow them up. For example, did sales improve? Observation is one way to measure the results.