Editor’s note: After we published Betsy Charles’s “Linking research and revenue” in the October 1999 issue, two readers raised serious questions about some sections of the article. Our policy, when this situation arises, is to publish the reader comments along with the response from the original author in the Letters section of a subsequent issue. Rather than respond directly to the reader-submitted comments (which are included in accompanying sidebars), Betsy Charles submitted this re-worked version of the original article.
Betsy Charles is president of Strategic Power, a research and consulting firm in Germantown, Wis.
Most managers evaluate a research proposal with this question in mind, “Will this research increase our company’s revenue?” They ask this question because their company paid for impractical research that had little value to the company. Although impractical research measures perceptions, its results are not linked to revenue. Thus, many managers consider research to be a cost, rather than a benefit, and avoid research unless they see its practical value.
The purpose of this article is to explain how to link research and revenue. The author presents several practical approaches that use ratings of customer satisfaction and/or employee attitudes to link specific improvements and company revenue.
Linking overall satisfaction and revenue
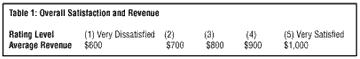
The first approach requires data on each respondent’s purchases from a strategic business unit (SBU) and a rating of overall satisfaction with the SBU’s performance. If these two variables are highly correlated, the next step is grouping respondents by their level of overall satisfaction and averaging the purchases of each group, as shown in Table 1. This hypothetical example implies that as buyers repeat their purchases the average revenue per customer increases by $100 as overall satisfaction increases by one level.
 |
Assuming the validity and direction of this relationship, repeat purchases, and no mitigating circumstances, we can attempt to increase revenue by increasing satisfaction. Although this approach does not specify the level of confidence for a range of results, applying this approach in several situations tests the effectiveness of this approach. If the actual relationship of satisfaction and revenue is similar to the predicted relationship, this implies that the approach is effective for this application.
Linking aspects of satisfaction and revenue
The second approach requires data on each respondent’s purchases and ratings of satisfaction with various aspects of SBU performance. The first step is multiple regression analysis with aspects of satisfaction as the independent variables and purchase amount as the dependent variable. Presuming no extenuating conditions, this analysis predicts with a specified level of confidence the range of each aspect’s relationship with revenue.
In addition, multiple regression analysis controls for shared effects resulting from correlated aspects of satisfaction. For example, if “Timely Delivery” and “Product Availability” were perfectly correlated, the first of these aspects to enter multiple regression analysis would explain all of their shared variance so the second aspect would not contribute to the solution and would not be entered in the final equation. Since the second aspect would not contribute to the solution, the results would not change if the second aspect were not included in the analysis.
By itself, multiple regression analysis does not prove whether satisfaction influences future revenue or revenue influences future satisfaction. However, analysis of cross-lagged panels of purchasing and satisfaction data points out the direction of the relationship. This approach requires at least two periods of data and relates previous satisfaction data with current revenue data and relates current satisfaction data with previous revenue data. Subtracting the results of these two analyses does not prove causality, but implies the direction of causal tendency. Replicating cross-lagged panel regression with more periods of data could show that this tendency is not a random occurrence.
If cross-lagged panel regression points out that an aspect influences revenue, then the coefficient of determination (R2) denotes the relationship of each aspect of satisfaction and revenue. Since this proportion measures the relative importance of each relationship, the aspects with the most important relationships tend to be key drivers of revenue, given no change in circumstances.
Quadrant analysis plots aspects of satisfaction by comparing importance to performance. Based upon this analysis and presuming consistency, a company’s strengths are important aspects that delight its customers and its weaknesses are important aspects that displease its customers. Since the relative priority of improvements depends upon the importance of this relationship and extent of customer dissatisfaction with performance, this is calculated as Importance * (1 – Performance). The priority of improvements must be interpreted with caution because both Importance and Performance denote a range at a certain level of confidence and assume causality and no mitigating circumstances.
Linking aspects of satisfaction and revenue for a set of SBUs
The two previous approaches require data on respondent purchases, whereas the remaining approaches require data on SBU revenue for a set of sales regions, company branches, franchise locations, etc. For example, if the set is 30 SBUs with 100 respondents each, our sample size is 30 SBUs, rather than 3,000 respondents. The data required for each SBU is at least two, and preferably three, periods of revenue data and the average response to each item in the survey.
As explained in the paragraph on controlling for shared effects, the first steps in this approach are correlating aspects of satisfaction with one another, deleting superfluous aspects, and correlating the remaining aspects with revenue. If cross-lagged panel correlation implies that satisfaction influences revenue, then the coefficient of determination denotes the relative importance of each relationship when all else is equal. Within sample size constraints and assuming no mitigating circumstances, multiple regression analysis measures the importance of the relationship between aspects of satisfaction and revenue.
A company can use this analysis with caution to measure the overall quality of an SBU’s performance. Its performance on each aspect is weighed by the importance of its relationship with revenue. Thus, the overall quality of an SBU’s performance is the aggregation of Importance * Performance.
Figure 1 demonstrates how quadrant analysis can compare importance and performance of one SBU (italic type) to the average performance of all SBUs (regular type). Assuming the situation does not change, a significant gap between SBU performance and average performance indicates an opportunity for improvement. Since this SBU has a strong performance on the important aspects of “Quality” and “Service,” these aspects tend to be the SBU’s comparative advantages.
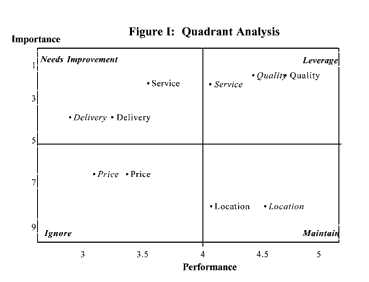 |
The figure points out that the SBU performs stronger on “Service” and weaker on “Quality” than the average SBU. The SBU performs weakly on the important aspects of “Location” and “Delivery” so improving these aspects are opportunities for increasing its revenue, assuming no extenuating circumstances. Given that the SBU has a weaker performance on “Delivery” than the average SBU, this opportunity tends to be greater than for the average SBU.
Linking employee attitudes and revenue for a set of SBUs
Similarly, we can link employee attitudes and revenue using SBU data on the attitudes of its employees and its revenue for at least two periods. Figs. 2 and 3 report the results of linking revenue with the attitudes of employees in a functional specialty. The arrows denote the direction of relationships pointed out by cross-lagged panel correlation. The letters in these figures refer to specific employee attitudes and the numbers are significant coefficients of determination from simple regression analysis. (Due to sample size constraints, we were not able to control for shared effects through multiple regression analysis.)
 |
Assuming no mitigating circumstances, Fig. 2 implies that Attitude A explains 70 percent and Attitudes B–D explain 10 percent of the variance in the relationship with Client Satisfaction and that Client Satisfaction explains 10 to 30 percent of the variance in the relationship with 13 employee attitudes.
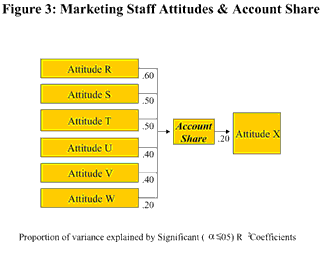 |
Fig. 3 points out that Attitudes R-W explain 20 to 60 percent of the variance in the relationship with Account Share and that Account Share explains 20 percent of the variance in the relationship with Attitude X.
Prioritizing improvements
These practical approaches relate research and revenue and all approaches except the first predict this relationship with a specified range of accuracy and level of confidence. The first two approaches require data on respondent satisfaction and purchases for at least two periods, whereas the other approaches require data for a set of SBUs on respondent satisfaction and/or employee attitudes and revenue for at least two periods.
The results of these approaches should be interpreted with caution because circumstances may change, customers may become satiated, and causality is implied, but not proven. Despite these caveats, the results of these approaches can help managers evaluate operations and prioritize improvements by their tendency to increase revenue.