Editor’s note: Stephen J. Hellebusch is president of Hellebusch Research & Consulting, Inc., Cincinnati.
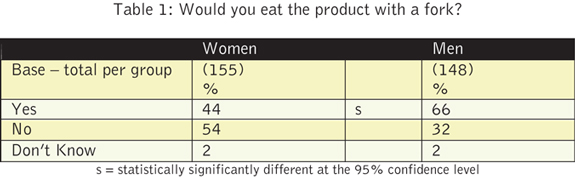
As many marketing researchers are aware, there are statistical tests built into the programs we use to show survey data. Most of these are set to operate at the 90 or 95 percent confidence level, and automatically test the difference between percentages in specified columns, as shown in the mock data example in Table 1.

As some marketing researchers are aware, the automatic test built into the survey programs is not the right test to use when there are more than two subgroups. You need a statistical test that will look at three percentages simultaneously, and that test is the chi-square (not to be confused with its cousin, the chi-square goodness of fit test).
The chi-square test looks at all the percentages and tests to see if what we have is different than what we would expect to have by chance alone. The logic behind it is actually deeper than this article will go, but, at one level it is cool.
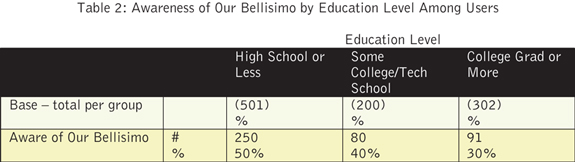
Take a look at the mock data in Table 2 as an example. We want to know if the three percentages differ significantly statistically at the 95 percent confidence level. If they do, we will hypothesize that awareness decreases with education level.
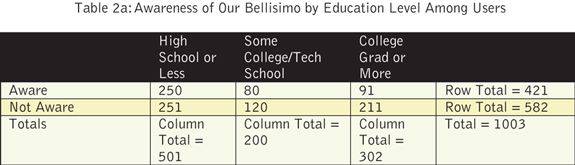
As Table 2a shows, the first step is to eliminate all the things that make the table pretty, and (oddly enough), to eliminate the percentages that we are interested in testing. We also add a new row. Since awareness is a zero-one concept (you are either aware or you are not), we add the number not aware, which we get just by subtracting the number aware from the total. Next, we add the rows to get totals, and put the bases in as the column totals.
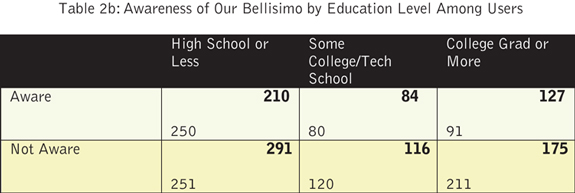
The chi-square test actually compares all the numbers in the cells to the number that you would expect to be in the cell by chance. You get this number for one cell by multiplying the row total by the column total and dividing by the total. For the first cell of 250, we would expect (421x501)/1003 = 210 to be in it. For the Some College/Tech School + Aware cell, (421x200)/1003 = 84, etc. The idea is neat. Table 2b shows the actual numbers and the expected values in boldface.
That’s it. There is no need to go through the whole formula for chi-square, since it can be found many, many places, and the rest of the logic of the test is the same as for all statistical tests of difference. (Compare the obtained chi-square to the table value of chi-square that one would expect if the percentages did not differ; if it is bigger, the percentages differ. If it is not, they do not.)
The logic compares the actual cell values to the cell values you would expect if the percentages do not differ, given that the row totals and column totals are what they are. You are comparing all of the percentages at once, but the logic is based on the number you expect to see in each cell. Better still, you can calculate that number and see for yourself, if you are so inclined.
Is our example chi-square significant at the 95 percent confidence level? It certainly is! Of course, it was constructed to have large differences, so that is really no surprise.