Editor’s note: Kirk Hendrickson is CEO of market research firm Eye Faster, Walnut Creek, Calif.
Price sensitivity is an interesting phenomenon that can be measured using eye-tracking technology, a methodology for measuring price sensitivity that can be applied to brands and categories across all retailers. The key data is found in fixations.
A fixation is a period of time lasting 200 milliseconds or longer where the eye rests on an area (product, price tag, signage, etc.). This is the shortest time in which the human brain can process information from stimuli on which the eye is fixated. Comparing the share (percentages) of the count of fixations that fall on price tags vs. products can indicate how sensitive shoppers are to the price tags in a store or category of goods.
 For consumer packaged goods and groceries, across all categories and retailers, the share of fixations on price (vs. products) can vary from 3 percent to as much as 20 percent, depending on the category and retailer.
A number of factors can influence shopper price sensitivity (how often shoppers focus on price as compared to product). Personal preference plays a leading role in how much attention shoppers give to price. Some shoppers spend without giving much consideration to the price, while others may be budget-conscious and very focused on prices. Here’s a look at several other factors identified through eye-tracking research.
1. Smaller packages on tighter shelves influence shoppers to spend more time viewing price tags.
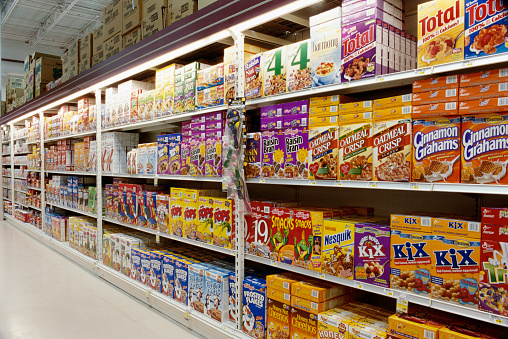
When it comes to breakfast, yogurt and cereal are two of the leading categories that shoppers regularly purchase. Let’s look at how price sensitivity can differ between the two. Shoppers were screened to ensure they were shopping certain categories (including cereal and/or yogurt), fitted with eye-tracking glasses and asked to shop their grocery store as they normally would. The resulting data showed that among cereal shoppers (n=29) 94 percent of fixations fell on products and 6 percent on price; in the yogurt category (n=27, with overlap) 85 percent of fixations fell on products and 15 percent on price.
As mentioned earlier, across categories and stores, fixations on price can vary from 3 percent to 20 percent, placing cereal on the lower end and yogurt on the higher end of the curve. There are a number of factors related to the consumer and the setup that can assist in influencing these differences. One major factor is how much more space cereal packages require in comparison to price tags on the shelf. Cereal boxes are much larger than a price tag and draw a greater share of shopper attention than yogurt packaging, which tends to come in smaller, single-serve packages that are not much bigger than corresponding price tags. Not only are cereal boxes bigger but in typical grocery stores products on-shelf can have several facings for a single SKU and only one price tag. Yogurt products come in a variety of flavors and are often displayed with a price tag directly below each stack of two to four products.
2. Comparing price sensitivity of household cleaning and personal products between grocers, drug stores and mass merchandisers.
The type of retailer and the individual store influence sensitivity to price tags, whether consumers realize it or not. Certain stores lend themselves to shoppers being more price sensitive than others, depending on category.
When looking at household goods, such as cleaning supplies and personal items, grocery stores, mass merchandisers and drug stores elicit quite different responses from shoppers when it comes to how much attention they give price tags. In one study, shoppers were most sensitive in drug stores, where almost one in five of all fixations fell on price as compared to product. Grocery stores came in second (one in 10 fixations fell on price).
Consumers associate buying household and personal care items with mass merchandisers that tend to offer the greatest selection, including bulk sizes, and often equate these stores with the lowest prices. When shopping for cleaning supplies and personal care items at mass merchandisers, we found that only 6 percent of fixations fell on price as opposed to products in the aisle.
Consumer perceptions and shelf-space allowances influence price sensitivity in grocery stores, drug stores and mass merchandisers. Consumers associate mass merchandisers with the lowest prices and drug stores with the highest for cleaning supplies and personal care items. In drug stores, there is much less shelf space and stock. Large mass merchandisers often have several aisles of cleaning supplies and personal items, with well-stocked shelves, giving each SKU more shelf space. With more product facings as compared to tags, there is an increased chance of fixations falling on products.
3. Shopper mood influences price sensitivity.
In the same study as above, a group of grocery category shoppers was given a free daisy to test how a simple mood-elevating act might affect price sensitivity. The results were astounding. After receiving a free flower as part of the test, shoppers were significantly less likely to focus on price and significantly more likely to focus on product.
According to Elissa Moses, CEO of the Ipsos Neuro and Behavioral Science Center, “the suggestion is that mood elevation can trigger a lower sensitivity to price. This could have huge implications for retailers.” Enhancing moods with something as simple as a free daisy can make shoppers spend more and be less price-conscious.
4. Price tags for products on sale – as well as those of associated products – receive a higher share of attention.
Relative size, as mentioned, can be a big influence on how much attention falls on price tags vs. products. By this logic, sale tags, which are usually larger, brighter in color and more appealing to shoppers than routine price tags, tend to draw more attention. In one study, price tags for regular price items received 6 percent of fixations as opposed to 94 percent on associated products. Meanwhile sale items in the same aisle received 18 percent of fixations compared to 82 percent on associated products.
While it should come as no surprise that sale tags receive greater interest and scrutiny than regular price tags, it’s true that a product being on sale (identified by having a sale tag) draws additional attention to that product. In the same example as above, 58 percent of the products in this particular grocery aisle were on sale (42 percent were regular priced – spread evenly throughout the aisle and shelves). However, sale products accounted for 71 percent of product fixations in the aisle while products not on sale accounted for only 29 percent of fixations.
Understanding how price sensitivity differs between products, categories, retailers and across international lines can help brands and retailers better understand how consumers consider the price of a product as they make their ultimate purchase decisions.