Healthy beverages selling well around the globe
Beverages that support healthy diets are among the world’s fastest-growing food and beverage categories, according to a study released by Schaumburg, Ill.-based ACNielsen Global Services. The report, titled What’s Hot Around the Globe - Insights on Growth in Food & Beverage Products, noted that drinkable yogurts in particular was the fastest-growing food and beverage category purchased by consumers worldwide. “Around the world, consumers are balancing health and nutrition concerns with a desire for convenience and value,” says Jane Perrin, senior vice president, managing director for ACNielsen Global Services. “Drinkable yogurt is not only healthy and good-tasting, but in many cases the packaging offers the convenience and portability that consumers crave.”
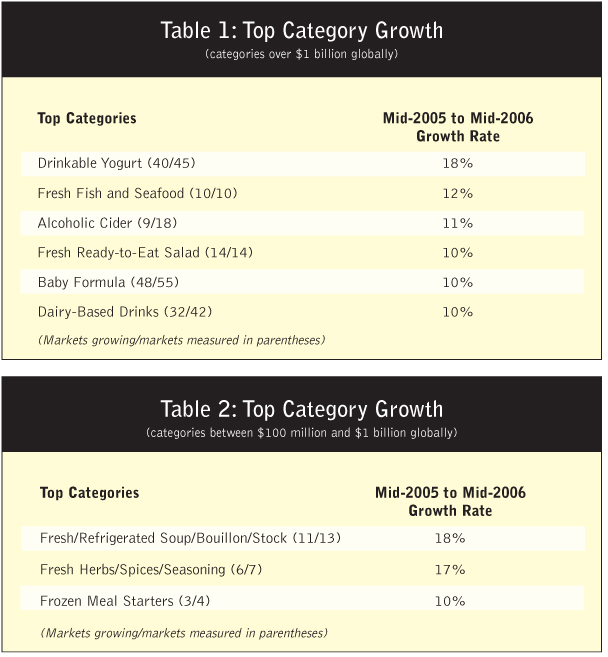
In total, nine product categories grew by double digits compared to 2005, with drinkable yogurts topping the list. In six of the nine categories, sales totaled more than $1 billion globally (Table 1).
Three categories between $100 million to $1 billion also showed double-digit growth (Table 2). Overall, the global growth across all of the food and beverage categories included in the study was 4 percent.

Drinkable yogurt, topping the list, exhibited year-over-year growth in 40 of the 45 markets measured, with 29 of these markets scattered around the world growing at more than 10 percent. China topped the list with a year-over-year growth rate of 49 percent. In markets as diverse as Greece, Romania, Finland and Italy, drinkable yogurt grew by more than 40 percent. Interestingly, in the United States, drinkable yogurt showed growth of only 5 percent.
Other dairy-based drinks (which includes items such as fruit-flavored milk and kefir-based drinks) also had strong growth across the board, with 32 markets (of the 42 measured) exhibiting growth. In most of these 32 markets, the growth was in double digits.
Marketing has helped the growth of these beverage categories. In some cases, drinkable yogurt and dairy-based drinks have used licensed characters to appeal to children, while the health benefits (and in the case of yogurt, the active cultures) appeal to parents. In markets such as Spain, Israel and Great Britain, for example, drinkable yogurt and probiotic yogurt were positioned in the marketplace as “heart-healthy” with the results being strong category growth.
Of the nine top categories listed, four categories were in the fresh arena - fish and seafood, ready-to-eat salads, soup, and herbs/spices. Many of these categories grew due to new product availability as well as more space being allocated in fresh/refrigerated sections of the store. In comparison, the frozen and shelf-stable varieties of the above items showed slower growth than their fresh counterparts did, and in the case of soup, actually showed a decline.
It is interesting to note that retailer private-label products have a strong presence in fresh categories. In fact, of the top 10 private-label food and beverage categories in terms of share, nine are fresh items (cakes, ready-to-eat salads, pizza, eggs, complete ready meals, soup/bouillon/stock, savory fillings/pastes, dairy/milk, fish/shellfish/seafood), with five (cakes, ready-to-eat salads, pizza, soup/bouillon/ stock, fish/shellfish/seafood) growing at a rate faster than manufacturer brands within the same category.
“It is clear that private-label dominates many of the fresh categories in retail stores,” says Perrin. “Retailers are focused on their consumers’ needs, and some have even created specially designed in-store areas for fresh and prepared foods. Consumers can quickly and conveniently shop for the meal components they need for their families.”
Other product categories that showed fast growth were those that made consumers’ lives more convenient. Ready-to-eat salad, baby formula and frozen meal starters all were among the fastest growing categories and had an element of convenience to them. Similar performance was seen within markets.
In China for example, baby food and formula were fast-growing because of focused marketing efforts on promoting these products as more convenient for younger families. In Hungary, meat-based baby food products drove the growth while baby food in jars sold well in Czech Republic and Slovakia.
The frozen meal starters category was driven primarily by the large year-over-year growth of these products in North America, particularly with new “breakfast starter” products. A relatively new category in many markets, this category again addresses consumers’ need for quickly prepared meals for their families.
The survey measured 66 markets around the world across more than 100 categories, comparing mid-year 2006 with mid-year 2005. These 66 markets account for more than 90 percent of the world’s real GDP and over 75 percent of the world’s population. The markets were grouped regionally into five areas (in order of market size): Europe, North America, Asia-Pacific, Latin America, and emerging markets.
The report was based on purchase information from retailers in grocery, drug and mass merchandise outlets and generally excludes kiosks or vending machines. In a few markets, sales from convenience stores may be included. Both total category and private-label information was collected for the report. For more information visit http://acnielsen.com.
Moviegoers just saying no
There’s nothing quite like watching a film on a giant screen. But as home theaters become more and more common (and affordable), should theater owners be worried? In a survey of consumers by Zogby Interactive, Utica, N.Y., nearly half (45 percent) said that, while they still go to the movies, their movie attendance has decreased from five years ago - 27 percent said it is much less, and 9 percent said they never go to the movies anymore.
As Hollywood struggles with a years–long box office plunge, Zogby finds that those age 25-34 are most likely to say their attendance has decreased over the past five years - and the oldest respondents (age 70 or older) are most likely to say they no longer go to the movies at all (23 percent).
Slightly more than a third (36 percent) say their movie attendance is about the same as it was five years ago. Overall, just 10 percent say their movie attendance has increased during that period of time - those age 18-24 are most likely to say their movie attendance has increased - 16 percent said they attend more now than they did five years ago. The Zogby Interactive poll of 10,145 adults nationwide was conducted January 26-29, 2007, and contains a margin or error of +/- 1.0 percentage points.
High ticket prices (30 percent) and a dislike for the movie selections (30 percent) are the top reasons given for falling movie attendance - 13 percent said they don’t like the crowds in the theater. Those age 18-24 are most likely to complain about costly tickets - nearly half (46 percent) said high ticket prices have kept them away from the theater. Among older adults, dissatisfaction with the film selections is the main deterrent - 46 percent of those age 65 or older said this.
More than a third (37 percent) of respondents said they go to the movies fewer than six times per year - 21 percent said they don’t even make it to the movies once a year. Overall, 10 percent said they never go at all. The youngest adults in the survey (those age 18-24) are most likely to say they go to the movies several times per month (9 percent) - this age group leads all others among those who said they go to the movies between six and 12 times per year. Attendance numbers decline among increasingly older respondents, the Zogby Interactive survey shows.
Theaters may offer massive screens and superior sound systems to moviegoers, but most would rather stay in the comfy confines of home and watch DVDs, the survey showed. The majority (63 percent) said they would rather have free unlimited DVD rentals with no late fees for a year than a year’s worth of free unlimited movie passes (30 percent). Those who live in large cities - and most likely have access to better theaters and more films - were more likely to choose the movie passes than those living in less populated areas. More than a third (37 percent) who live in cities favor unlimited movie passes, compared to 23 percent who live in rural areas. Rural respondents without access to as many theaters and films were much more likely to choose the DVD rentals - 71 percent picked the DVDs compared to 58 percent who live in large cities.
DVDs again beat out movies by a wide margin when people were given the choice between 100 free DVDs of their own choosing (71 percent) or 100 free movie passes (24 percent). Women (26 percent) were slightly more likely than men (22 percent) to favor 100 free movie passes, while nearly a quarter (72 percent) of men and (69 percent) of women would choose the DVDs. For more information visit www.zogby.com.
C-store shoppers go in thirsty
Today’s convenience store shoppers are seeking cold beverages, friendly employees and know what they want before they get through the door, according to a new study by Meyers Research Center, New York. The findings are part of Meyers Convenience Store Close-Up Wave Six, which takes a look at behavior, attitudes and decision-making patterns of c-store shoppers in the United States. The study also disclosed that nearly half of all consumers surveyed said they are making sacrifices to pay higher gas prices at the pump.
“C-store shoppers are telling us that the helpfulness and the friendliness of the employees was rated high when selecting a store to shop in, along with fast checkout and cleanliness,” says Jeff Friedlaender, vice president, Meyers Research Center.
“Higher gasoline prices are driving consumers to less convenient locations in search of lower prices, which are more important than finding the most convenient c-store,” Friedlaender says.
The study was fielded in July, August and September of 2006. The research was conducted via in-store intercept interviews with consumers as they were exiting the convenience store, immediately after they finished paying for their purchases. A random sample of 1,074 convenience store shoppers were interviewed in 31 locations across 17 geographically dispersed U.S. cities.
The cost of gas is of concern to c-store shoppers and the majority would choose access to lower-cost gas above their own convenience. Half of the subjects (48 percent) said they had to give up something in order to pay higher gas prices over the summer of 2006. Most often relinquished were vacations/travel, dining out/take-out and entertainment (movies, theater, sporting events). To a lesser extent, people also cut back on shopping, particularly of apparel and DVD movies/games. A minority of 2 percent said groceries or utility bills were sacrificed.
Seventy-five percent of shoppers surveyed said “helpful, friendly employees” outweighed factors such as good prices (38 percent), fast checkout (38 percent), wide selection (27 percent) and prepared foods (3 percent) when deciding which c-store outlet to shop in.
The influence of in-store factors in c-stores has dropped since the study was last conducted in 2004, falling from a 2004 level of 12 percent to 4 percent in 2006. Either there is less in-store marketing being used or it is less compelling to consumers. “Convenience store shoppers are making purchasing decisions based on category planning and the role that the c-store plays in their day-to-day activities,” says Friedlaender.
Over 85 percent of products purchased at the c-store are consumed within 30 minutes of checkout and over half within five minutes, usually by the shopper him/herself and nobody else. More than half (56 percent) of shoppers said that they plan to consume their purchases in the car while traveling.
A cold drink purchase is made by about half of the shoppers - the most typical purchase by far. Shopping for snack food and cigarettes is also highly prevalent. Gas is frequently purchased at stores selling gas; among the shoppers buying merchandise in a c-store with an attached gas station, 25 percent were purchasing gas, slightly lower than in 2004 (30 percent).
Purchasing a cold beverage leads the list of things that lure consumers to c-stores. The purchase of gas and cigarettes also plays a very important role in driving much convenience store traffic. However, the need to buy gas is slightly less of a driver to c-stores than in 2004, being replaced by snack food and lottery ticket purchasing. For more information contact Jeff Friedlaender at 800-221-5015 or visit www.meyersresearch.com.
2006 saw a record number of new CPG products
According to the Mintel Global New Products Database, in 2006 a record-breaking barrage of new products flooded store shelves. Close to 182,000 new products were introduced globally, with key booming areas focusing on mind, body and general good health.
Almost 105,000 food and drink products were launched last year alone - around 300 for every day of the year. Coupled with more than 77,000 non-food product launches hitting the market last year, new launches overall experienced a 17 percent gain on 2005 launches. This more than doubled the growth in new CPG launches from 2004 to 2005.
“The significant shift to more products with better-for-you positioning helped boost new product launches in 2006,” says David Jago, director of Chicago-based Mintel Custom Solutions. “The strong focus in many categories is on promoting good health, which can be seen in the most popular product claims. Companies are offering more products that enhance well-being for consumers.”
Low-carb products continue to move out of grace with consumers, with the category posting only 500 global food introductions in 2006. This is less than half the level of launches achieved in the same category in 2005, and only 15 percent of the launches introduced during its peak in 2004.
In contrast, other “food minus” trends - products that highlight a reduced amount of fat, calories, sugar and cholesterol - are sharply on the rise. Low/no trans-fat and gluten-free are the key movers of this category, showing major increases. Low/no trans-fat products are up by nearly 120 percent, more than doubling from 2005, due primarily to North American regulations (the region accounts for 80 percent of these food and drink claims). This trend shows development promise, particularly in Europe.
Gluten-free experienced an 86 percent jump in 2006 product launches, with strong growth in North America, Europe and Latin America. Companies are placing a stronger focus on allergen-free foods, which have seen greater growth into mainstream retailers.
Food and drink product launches with an ethical positioning nearly doubled last year, with ethical labeling appearing in more diverse product categories.
Ethical products are defined as those that include ingredients linked to fair trade or sustainability, also expanding to products that make ecological claims or link to charitable concerns. The ethical movement has spread through more countries globally within the past year, and doesn’t show any signs of slowing in 2007. Non-food ethical claims tripled their growth in 2006, including significant gains by products with fair-trade ingredients and cause-related focuses.
Organic is also continuing to see major developments. As a claim, organic has been a rising star in food for the last few years. However, in the non-food arena, products that are wholly or partly organic grew by about 30 percent.
In 2006, superfoods greatly impacted mainstream CPG product launches. Pomegranate was one of the strongest stars of the year, especially in beverages. Due to the fruit’s major success, companies are looking for the next big star. Mintel has seen great promise in açaí, an antioxidant-rich berry. “Açaí lends itself well to premium, indulgence positioning, offering all of the health benefits of other superfood ingredients,” says Lynn Dornblaser, director of Mintel Custom Solutions. “It has a strong exotic appeal, bolstered by its Amazonian origination. We really see the fruit as the one to watch for ingredient sourcing in the future.” For more information visit www.mintel.com.
Digital divide still exists in Canada
A study by Vancouver-based Ipsos Reid, Older Canadians and the Internet, has found that older Canadians lag significantly behind those in other age groups when it comes to their online usage and proficiency, showing that the digital divide is still alive and well in Canada.
Currently, only 61 percent of Canadian adults aged 55 or older have access to the Internet from any location, compared to 88 percent of adults aged 18-54, a gap of 27 points. And while this gap has narrowed slightly in the past three years, it is not significant enough to draw any conclusions about longer-term implications. In 2001, just over eight of 10 Canadian adults aged 18-54 (82 percent) had access to the Internet, while just under half of those aged 55 or older (48 percent) had access. The gap was between 34 and 36 points from 2001 to 2003, and has since narrowed to 24 to 27 points in the past three years. In addition to being less likely to be online overall, older online adults spend nearly 35 percent less time online per week than younger Canadians (8.7 hours aged 55+; 13.3 hours aged 18-54), and the gap in terms of usage has not narrowed appreciably over the past six years.
“Some experts would like us to believe that the Internet is a universal medium that can reach all Canadians whether it be for a marketing, communications or social perspective, but our research shows that there are considerable flaws in this thinking,” says Steve Mossop, president of market research Canada West for Ipsos. “The Internet is by no means universal, and there are important gaps like the older Canadians segment that simply cannot be ignored. The digital divide was predicted to disappear but our research shows that while the gap is narrowing slightly, the divide is very real.”
Behaviorally, older Canadians lag behind the younger groups in each of 20 common online activities online Canadians have ever participated in. The gap is largest for listening to Internet radio (34 percent), downloading free MP3 files (32 percent), visiting blogs (23 percent), conducting online banking (21 percent), researching courses and schools (21 percent), comparison shopping (20 percent), searching for real estate (18 percent), researching trips (17 percent), using the Internet at work for personal reasons (17 percent), and purchasing online (14 percent). The gap is smaller for activities such as purchasing travel (6 percent), using online photo services (7 percent), and visiting homes for sale first found online (zero gap). The only online activities online Canadians aged 55 and older are more likely to participate in are taking courses directly online (+3 percent), buying/selling investments (+3 percent) and earning a degree or diploma online (+4 percent).
Attitudinally, the gaps are quite large. Only one in eight online adults aged 55 and older (13 percent) claim to be expert/very skilled users of the Internet, compared to 35 percent among 18-54-year-olds. There is a large difference in how older and younger Canadian adults feel they use the Internet in their daily lives. Those aged 55 and older are less likely to feel the Internet is an important part of their daily routine (41 percent agree among those aged 55+ vs. 53 percent agree among those aged 18-54), and online Canadians aged 55 and older are significantly more likely to be “very concerned” about online security (45 percent aged 55+; 37 percent aged 18-54). For more information visit www.ipsos.ca/reid.