
Help them help you
Editor's note: Erwin Chang is head of marketing research (consumer insights) at Novamex (Jarritos soft drink company). With more than 20 years of experience, he helps organizations improve business decisions through consumer insights, research innovation and a deep understanding of consumer behavior across CPG, beverage, telecommunications, automotive and healthcare. Find Chang on LinkedIn.
As I started experimenting with using AI as part of my questionnaire workflow, I noticed a pattern in the revisions I kept making. The more questionnaires AI generated for me, the more often I found myself making the same edits.
At first, I assumed I was refining the wording or adapting each questionnaire to the objectives of a particular study. But after making similar revisions across project after project, I began to notice a pattern. Most of my edits had little to do with research methodology; they were almost always about respondent behavior.
That surprised me because, with the right prompt and enough context, AI had become remarkably good at writing questionnaires. It consistently produced logical, comprehensive instruments grounded in established research practices. They were often excellent starting points. Yet they still assumed that respondents would behave the way questionnaires expected them to behave.
Researchers experience a questionnaire very differently from respondents. When we design or review one, we understand why every question matters. We know the objectives, the logic and how the answers will eventually be analyzed. Respondents usually see one screen at a time – often on a phone and often while doing something else. They scan before they read, shifting attention among the stimulus, the question and the response options. As effort accumulates, they rely on familiar patterns and shortcuts to keep moving.
As I reflected on those recurring edits, the underlying issue became clearer. The greatest opportunity was not necessarily writing better questions; it was designing questionnaires around how people actually answer them.
To explore that idea, I conducted a series of randomized online survey experiments which, together with more than 20 years of designing consumer research on both the supplier and client sides, led me to six connected principles that form what I call The Respondent Journey – a behavioral lens for understanding what people experience as they move through a questionnaire (Figure 1).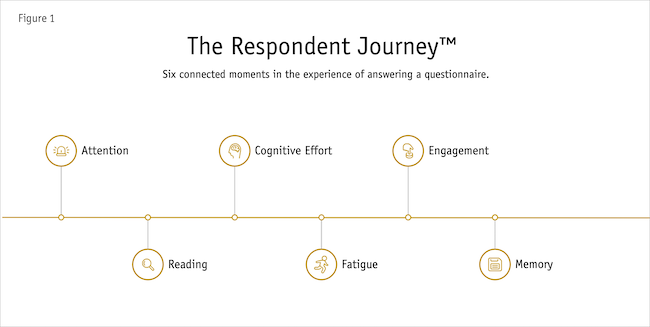
These are not rigid stages that occur only once. They overlap and influence one another throughout the questionnaire. Together, however, they offer a practical way to ask whether a survey works with human behavior – or unintentionally works against it.
Methodological note: Unless otherwise indicated, the experiments below are based on 800 qualified U.S. respondents, divided into two randomized groups for each comparison. The behavioral-validation analysis began with 1,479 screened respondents; 679 did not meet the validation criteria, leaving a qualified net sample of 800.
Principle 1: Attention precedes evaluation
Attention is the first moment in the respondent journey because people cannot evaluate what they never fully noticed.
For years, I shared an assumption that I suspect many researchers make when designing concept tests: If respondents were shown a concept, package or advertisement before answering a question, I assumed they had processed it. After all, the stimulus was right there on the screen.
Over time, however, I began to question whether seeing and processing were really the same thing. A typical concept test may require respondents to examine a stimulus, interpret what they see, read the question, understand the response scale, compare the options and decide what to select – all on the same screen. Faced with several competing tasks, people naturally prioritize the one that appears most immediate. That task is usually answering the question, not carefully studying the concept.
To test the effect, I created a fictional ready-to-drink vanilla coffee label. One group viewed the package by itself for several seconds before advancing to the evaluation questions. A second group saw the identical package alongside those questions, reflecting the way many concept and package tests are commonly designed. Both groups were later asked what type of product they had seen and what brand appeared on the package.
Among respondents who viewed the package before answering any questions, 89% correctly identified the product category. When the package appeared alongside the evaluation questions, that figure fell to 72%. Brand recall showed a similar pattern, declining from 92% to 75%. Both differences were statistically significant at the 95% confidence level.
The package was identical. The questions were identical. The meaningful difference was whether people were allowed to complete one cognitive task before beginning the next. They were not behaving carelessly; they were behaving efficiently. When observation, interpretation and evaluation compete for the same limited attention, one of them will receive less attention than intended.
Research implication: Separate exposure from evaluation. Whenever possible, give respondents a brief opportunity to process a concept, package or advertisement before asking for their opinion. Reducing competing cognitive demands allows them to focus on one task at a time and can improve attention, recall and the quality of the data that follows.
Principle 2: Respondents scan before they read
Once respondents have processed the stimulus, the next question is whether they notice what the questionnaire is asking them to do.
Most people do not approach a questionnaire as researchers do. They scan the screen for cues that will help them complete the task efficiently. Their eyes are drawn to words that stand out, familiar visual patterns and information that appears immediately relevant. Only then do they decide what deserves closer attention.
Recognizing that changed the way I approached questionnaire writing. My objective was no longer simply to write questions respondents could understand. It became equally important to ensure they immediately noticed the few words essential for answering accurately.
To test this idea, one group received the instruction, "From the following list, select the option other." A second group received the shorter instruction, "Select OTHER." The response options were identical – male, female and other – but in the second version, the critical word was capitalized and visually emphasized.
Only 11% of respondents who received the first instruction selected the requested answer, compared with 42% of those who saw the shorter, emphasized version. The task itself was identical; only the visual guidance differed.
Formatting is not merely cosmetic. Used deliberately, bold text, capitalization, underlining and, when appropriate, color can guide respondents toward the information they need most. If a question asks about behavior during the LAST 7 DAYS, making that time frame immediately visible may improve data quality more than adding another explanatory sentence.
There is an important qualification: These experiments were conducted among U.S. respondents and the application should reflect local expectations. In some markets, concise wording and visual emphasis feel intuitive. In others, respondents expect questions to be more courteous, contextualized or indirect. The behavioral principle remains the same, but its execution should fit the culture and conventions of the population being studied.
Research implication: Emphasize the words respondents must notice. Write questions not only for comprehension but also for attention. Rather than adding more words, make the time frame, instruction or decision criterion easy to find using the visual and verbal conventions that feel natural in the market.
Principle 3: Familiarity reduces cognitive effort
Even when respondents notice the right words, the response format itself can create unnecessary mental work.
Researchers spend considerable time discussing measurement scales: five-point versus seven-point scales, verbal versus numeric labels and the circumstances in which a semantic differential is most appropriate. Those decisions matter but they sometimes overlook a more basic question: Which format feels most natural to respondents?
A scale can be methodologically sound and still require avoidable effort. Every moment people spend figuring out how to answer is a moment they are not thinking about the product, concept or experience we want them to evaluate.
I compared three response formats: traditional checkbox ratings, star ratings and semantic differential scales. After answering equivalent questions using each format, respondents were asked which one they preferred. Just over half, 52.4%, preferred star ratings, compared with 29% for traditional checkboxes and 18.6% for semantic differentials.
Their explanations were revealing. Many described the semantic differential as confusing, while others said they tended to gravitate toward the extremes without paying much attention to the options between them. By contrast, people encounter star ratings routinely when they shop online, review restaurants, book hotels or rate entertainment. Because they already understand the format, they can concentrate on the evaluation instead of first decoding the scale.
This does not mean stars are always the right choice or that semantic differentials should disappear from research. Every format has circumstances in which it is methodologically appropriate. The lesson is narrower: When two formats answer the same business question equally well, the more familiar option will often create a better respondent experience.
Research implication: Choose familiar formats when the methodology allows it. The hard part should be evaluating the subject – not figuring out how to use the scale. Reducing unnecessary cognitive effort leaves more attention for the decision that matters.
Principle 4: Fatigue reduces consistency
Cognitive effort does not remain constant throughout a questionnaire. As the experience continues, it accumulates.
Researchers often focus on survey length but questionnaire experience matters just as much. Two surveys may contain the same number of questions and still feel very different depending on how they are designed. Long grids, repetitive formats and uninterrupted blocks demand sustained concentration from people whose attention naturally declines over time.
The problem is not simply boredom. It is the gradual depletion of mental resources. As a questionnaire becomes more repetitive, respondents are more likely to rely on shortcuts, respond automatically or pay less attention to subtle differences between questions.
To test whether a small interruption could help, one group completed a long evaluation grid without a break. A second group answered the identical grid but, after several rows, encountered a page break displaying a brief message: "You are doing great. We are loading your next questions." Five seconds later, the survey continued.
The questionnaire also included two questions that were intentionally repeated later. If respondents remained engaged, their answers should remain reasonably consistent. For one repeated item, consistency increased from 78% to 86%. For the second, it improved from 88% to 94%.
We did not shorten the questionnaire, simplify the questions or reduce the number of evaluations. We simply acknowledged that respondents are human. A brief opportunity to pause was enough to restore attention and improve consistency.
The point is not that every survey needs a five-second timer. Depending on the study, the better choice may be to divide a grid across pages, vary the response format, provide a progress cue or remove repetitive questions that do not materially improve the decision. The broader point is that analytical efficiency and respondent efficiency are not always the same.
Research implication: Break long tasks and vary the pace. Design the respondent’s experience, not just the questionnaire’s structure. Brief mental breaks, changes in format and smaller task units can reduce fatigue and improve response consistency without sacrificing the information needed for business decisions.
Principle 5: Never assume engagement
Even a thoughtfully designed and well-paced questionnaire still requires evidence that completion reflects plausible engagement.
This principle has influenced my thinking more than any other. The quality of our analysis can never exceed the quality of the data we collect. Sophisticated models, segmentation techniques and artificial intelligence can reveal important patterns but none of them can compensate for answers that do not realistically reflect consumer behavior.
In a separate study, 65% of respondents reported taking surveys every day, completing an average of 7.6 surveys daily. One participant reported taking as many as 30 in a single day. Those findings should not be interpreted as evidence that frequent respondents provide poor-quality data. Many panelists are thoughtful and conscientious. They simply remind us that survey participation has become routine for many people and engagement naturally varies from one respondent and one survey to another.
The question, then, is not whether respondents ever make mistakes. It is whether the overall pattern of answers reflects something a real consumer could plausibly have done.
To explore that question, respondents were asked which products they had consumed during the LAST 7 DAYS. The list included real products and a small number of fictitious ones. Some respondents reported consuming products that did not exist. Others claimed to have consumed 10 or more brands in the same category during that seven-day period. Neither response alone automatically proves poor-quality participation. Together with other answers, however, they can form a pattern that is internally inconsistent or realistically unlikely.
Again, of the 1,479 people screened, 679 did not meet the behavioral-validation criteria, leaving 800 qualified completes for the final sample.
The difference between validation methods was substantial. Traditional open-ended checks flagged approximately 1% of the screened sample, while conventional control questions flagged 8%. Behavioral validation – combining fictitious products with an assessment of response plausibility – flagged approximately 46%.
That result should be interpreted carefully. It does not establish that 46% were consciously dishonest. It means their overall response patterns did not meet the study’s behavioral-validation criteria. The objective is not to punish an unusual answer or catch someone making a mistake. It is to determine whether the complete pattern is internally consistent and realistically possible.
More recently, I have expanded this approach by incorporating AI-generated product images, package designs and fictitious innovations into validation exercises. The purpose remains the same: not to create a more elaborate trap but to increase confidence that the data reflects behavior that could exist in the real world.
Research implication: Validate plausible behavior, not completion alone. Treat respondent validation as part of questionnaire design rather than as an afterthought. Evaluate patterns across answers, use more than one indicator and distinguish between an isolated mistake and a response profile that does not meet the study’s plausibility criteria.
Principle 6: Richer questions draw from memory to produce richer answers
Once the quality of participation has been protected, the final opportunity is not merely preventing weak data; it is helping people communicate their experiences more completely.
For decades, researchers have used open-ended questions to understand motivations, emotions and consumption occasions. The limitation was rarely the value of the responses. It was the cost and effort required to analyze them. Coding hundreds or thousands of verbatims demanded significant resources, so many quantitative studies limited the number of qualitative questions they included.
That constraint shaped the way we asked people to remember. A prompt such as "Describe your most common consumption occasion" asks someone to retrieve several experiences, decide what is typical, organize the details and summarize everything in one response box. Unsurprisingly, many answers consist of only a few words – not because people have nothing to say but because summarizing an experience from memory is difficult.
Instead of asking respondents to summarize, I began asking them to reconstruct one specific occasion through a battery of short open-ended questions. Thinking about the last time they consumed the product, they were asked: What time of day was it? Where were they? Who were they with? What were they doing? Why did they choose that brand? How did they feel?
Individually, none of those questions is remarkable. Together, they guide people through the natural process of remembering. A specific moment begins to reappear and the added context reveals motivations, routines, emotions and social influences that often remain hidden in one broad open-end.
This is also where AI genuinely changes the equation. Years ago, I might have hesitated to recommend a qualitative battery because analyzing that volume of text was expensive and time-consuming. Today, AI can rapidly organize themes, identify recurring patterns, compare segments, estimate prevalence and surface representative verbatims. Its greatest contribution may not be helping us analyze more responses; it may be giving us the freedom to ask richer questions that were once too costly to analyze.
These batteries should still be used selectively. They require more effort from respondents and do not replace traditional qualitative research or the structured measures needed for longitudinal tracking. But when a deeper understanding will influence an important business decision, helping people remember can produce more useful insight than asking them to summarize.
Research implication: Reconstruct a specific experience. Replace one broad open-ended question with a focused sequence that helps respondents retrieve context, motivation and emotion. Richer answers do not come from asking people to write more; they come from making remembering easier.
From six principles to one journey
Viewed together, the six principles become a practical prelaunch review. Did respondents have a fair opportunity to process the stimulus? Will they notice what matters? Is the response format intuitive? Does the survey manage fatigue? Do the answers form a plausible behavioral pattern? And when memory matters, does the questionnaire help people reconstruct an experience?
Together, those questions form The Respondent Journey (Figure 2). The framework connects six behavioral moments with six practical design actions.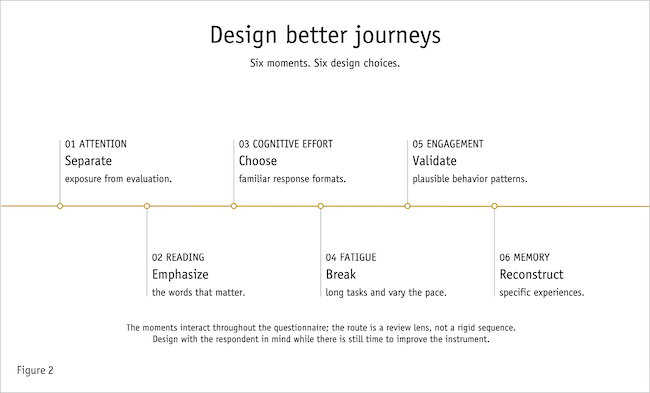
The framework does not replace methodological judgment. How each action is applied will still depend on the research objective, population, culture and methodology. Its value is that it adds the respondent’s perspective while there is still time to improve the instrument.
Advances should be welcomed
Artificial intelligence will continue transforming consumer research. Questionnaires will become easier to generate, qualitative data easier to analyze and reports faster to produce. Those advances should be welcomed because they allow researchers to spend less time on routine tasks and more time thinking about the business decisions our work is meant to inform.
AI will also become better at recognizing many of the behavioral principles described here. Even then, applying them will require judgment, context and an appreciation of the people behind the data. A questionnaire can be well written, logically organized and methodologically defensible – and still create an unnecessarily difficult respondent experience.
A better respondent experience does not guarantee a better business decision. It does, however, improve the quality of the evidence behind it. When a questionnaire supports attention, reduces unnecessary effort, manages fatigue, validates engagement and helps people remember, the data has a better chance of reflecting the consumers we are trying to understand.
AI can help us write questionnaires. Our job is to design respondent journeys – not around how researchers think but around how respondents actually behave.