
Editor's note: Philip Moore is senior research consultant at MDC Research, Portland, Ore.
I was trying to schedule a follow-up call with a client today, a market research manager at a Fortune 500 retailer, and he was fully booked, in some cases double-booked, for more than two weeks. I inquired about this unusual level of engagement for a research manager and he shared that in addition to his normal marketing meetings he is regularly invited to meetings with finance and strategy teams. These are not quarterly updates or meetings to report on specific projects but early-stage tactical discussions. For years our industry has been talking about getting a seat at the table and here is someone actually doing it. Further discussion revealed why he has become such a valuable asset to his company and put himself on the fast track to promotion.
His method is replacing the traditional language of marketing research with the currency of strategy and finance, which is literally currency. I learned this reporting approach shortly after moving to the client side 20 years ago. We had a traditional VOC program that provided monthly customer satisfaction ratings. The survey results were summarized as Net Promoter Scores (NPS) and uploaded to a BI platform. Location managers discussed the scores with their regional directors, with praise heaped upon the top performers and direction to “do better” leveled at the rest. This had been the standard operating procedure for many years. As a result, the marketing research department was quite unpopular with the sales organization.
The innovation that repaired this relationship was converting the NPS reporting to an opportunity analysis expressed in dollars and adding two levels of reporting: sales team and individual sales associate. We had enough survey responses to correlate sales conversion with likelihood to recommend by quarter. Figure 1 shows what the relationship looked like.
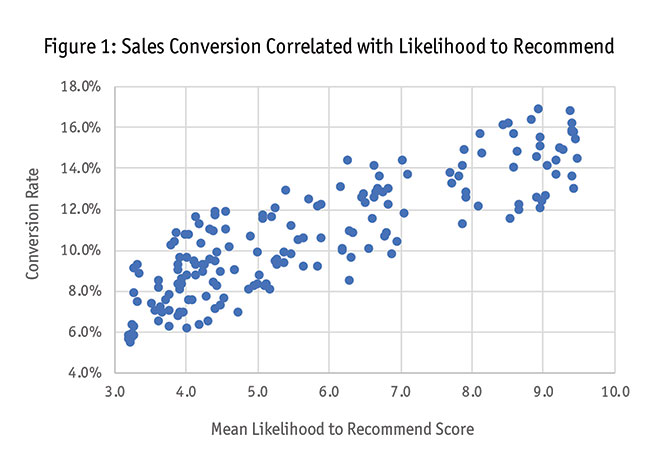
Securing conversion rates for the individual associates was initially a manual process because the research department was not granted access to sales data. We had to e-mail individual sales managers to get the quarterly performance data for their teams. Once we had the necessary data, estimating the impact of a one-point increase in likelihood to recommend on sales revenue was a straightforward regression analysis.
Another advantage of merging survey and associate-level sales data for regression analysis was an opportunity for a more sophisticated analysis including variables like region and job tenure. We discovered a slight regional bias in likelihood-to-recommend scores and an interesting non-linear relationship with time on the job. Including variables for these factors in the regression produced a more accurate understanding of how each associate was performing, controlling for where they worked and how long they had been with the company.
Showing a sales associate what they could earn if they improved customer satisfaction is certainly more compelling than simply reporting their Net Promoter Score but the real value comes from revealing how to do it. Unfortunately, my predecessor had bought the NPS story hook, line and sinker. The survey instrument I inherited had been pared down to three questions so no diagnostic measures were available. Reporting revenue opportunity created a great deal of excitement among the sales leadership. The increased interest made securing a 50% increase in VOC budget to expand the survey an easy ask.
Three months after launching the revised survey we were helping individual sales associates improve their personal conversion rates. Some struggled with initial greeting, others with attentiveness to customer needs. One of the most impactful outcomes of the expanded survey was to identify the top performers on specific metrics and pair them for a period of retraining with their underperforming peers. The results were spectacular and the VOC program was fully integrated into the sales management process. We were granted full access to sales data and assigned IT resources to build automated reporting.
The next time you find yourself saying “Seventy-eight percent with a confidence interval of ±3 percent,” consider the potential impact of alternative language like, “$3.6 to $4.4 million in additional revenue.” That is the common language of business and something non-researchers can act upon. Modeling these estimates takes more work but it’s worth it.