

Proving incremental lift with geo testing
Editor’s note: Eric Brinker is an independent marketing measurement consultant at Brinker Analytics. He has hands-on-keyboard experience running over $100M in DTC media and has run over 70 incrementality tests. He is based in Nashville, TN and can be reached for more info on marketing measurement at eric@brinkeranalytics.com. Find Brinker on LinkedIn.
“YouTube isn’t working. Look at that ROAS [return on ad spend].”
So, you’ve got UTM tracking (tags added to the end of a URL to track a campaign) that says that Facebook does better than YouTube. But you think YouTube might have a halo effect on Facebook.
But how can you prove that YouTube’s main effect is to make people want to click Facebook ads more? That YouTube was a deciding factor in a customer’s mind when they saw three more Facebook statics that week?
Can a pixel tell you? Can a click-based attribution system tell you?
The answer is to run a geographic test.
If you have Google Analytics, export your sales by day by designated marketing area (DMA). Make this export 12-56 weeks back. It will be helpful to check different date ranges. If you don’t have this much data, stop here. You may not have enough data to get the baseline you need for a geo test.
Your Google Analytics 4 (GA4) may not be perfect. But for all its faults, GA4 places sales in Nielsen DMAs. And it does so in the same way your digital spend does: by IP address.
Open an AI coding assistant. Give it your GA4 exports. Ask for a treatment cell and a control cell based on your data, with these high correlation and low mean absolute percentage error (MAPE).
Tell your AI you’re trying to prove a lift with a minimum detectable effect at 90% confidence and 80% power.
Then begins your health checks.
Check 1: Is the comparison strong enough?
Before changing your media, your cells are worth comparing.
So you ask a series of questions:
Do they correlate?
Ideally you have a 95% or higher correlation, even over a longer date range like 6 months or longer.
How closely do they stick to each other?
Ask your coding AI to scale the control and check the MAPE. MAPE is a daily percentage difference, on average. The lower the MAPE, the more your cells are like each other every day. Your goal is below a 10% MAPE.
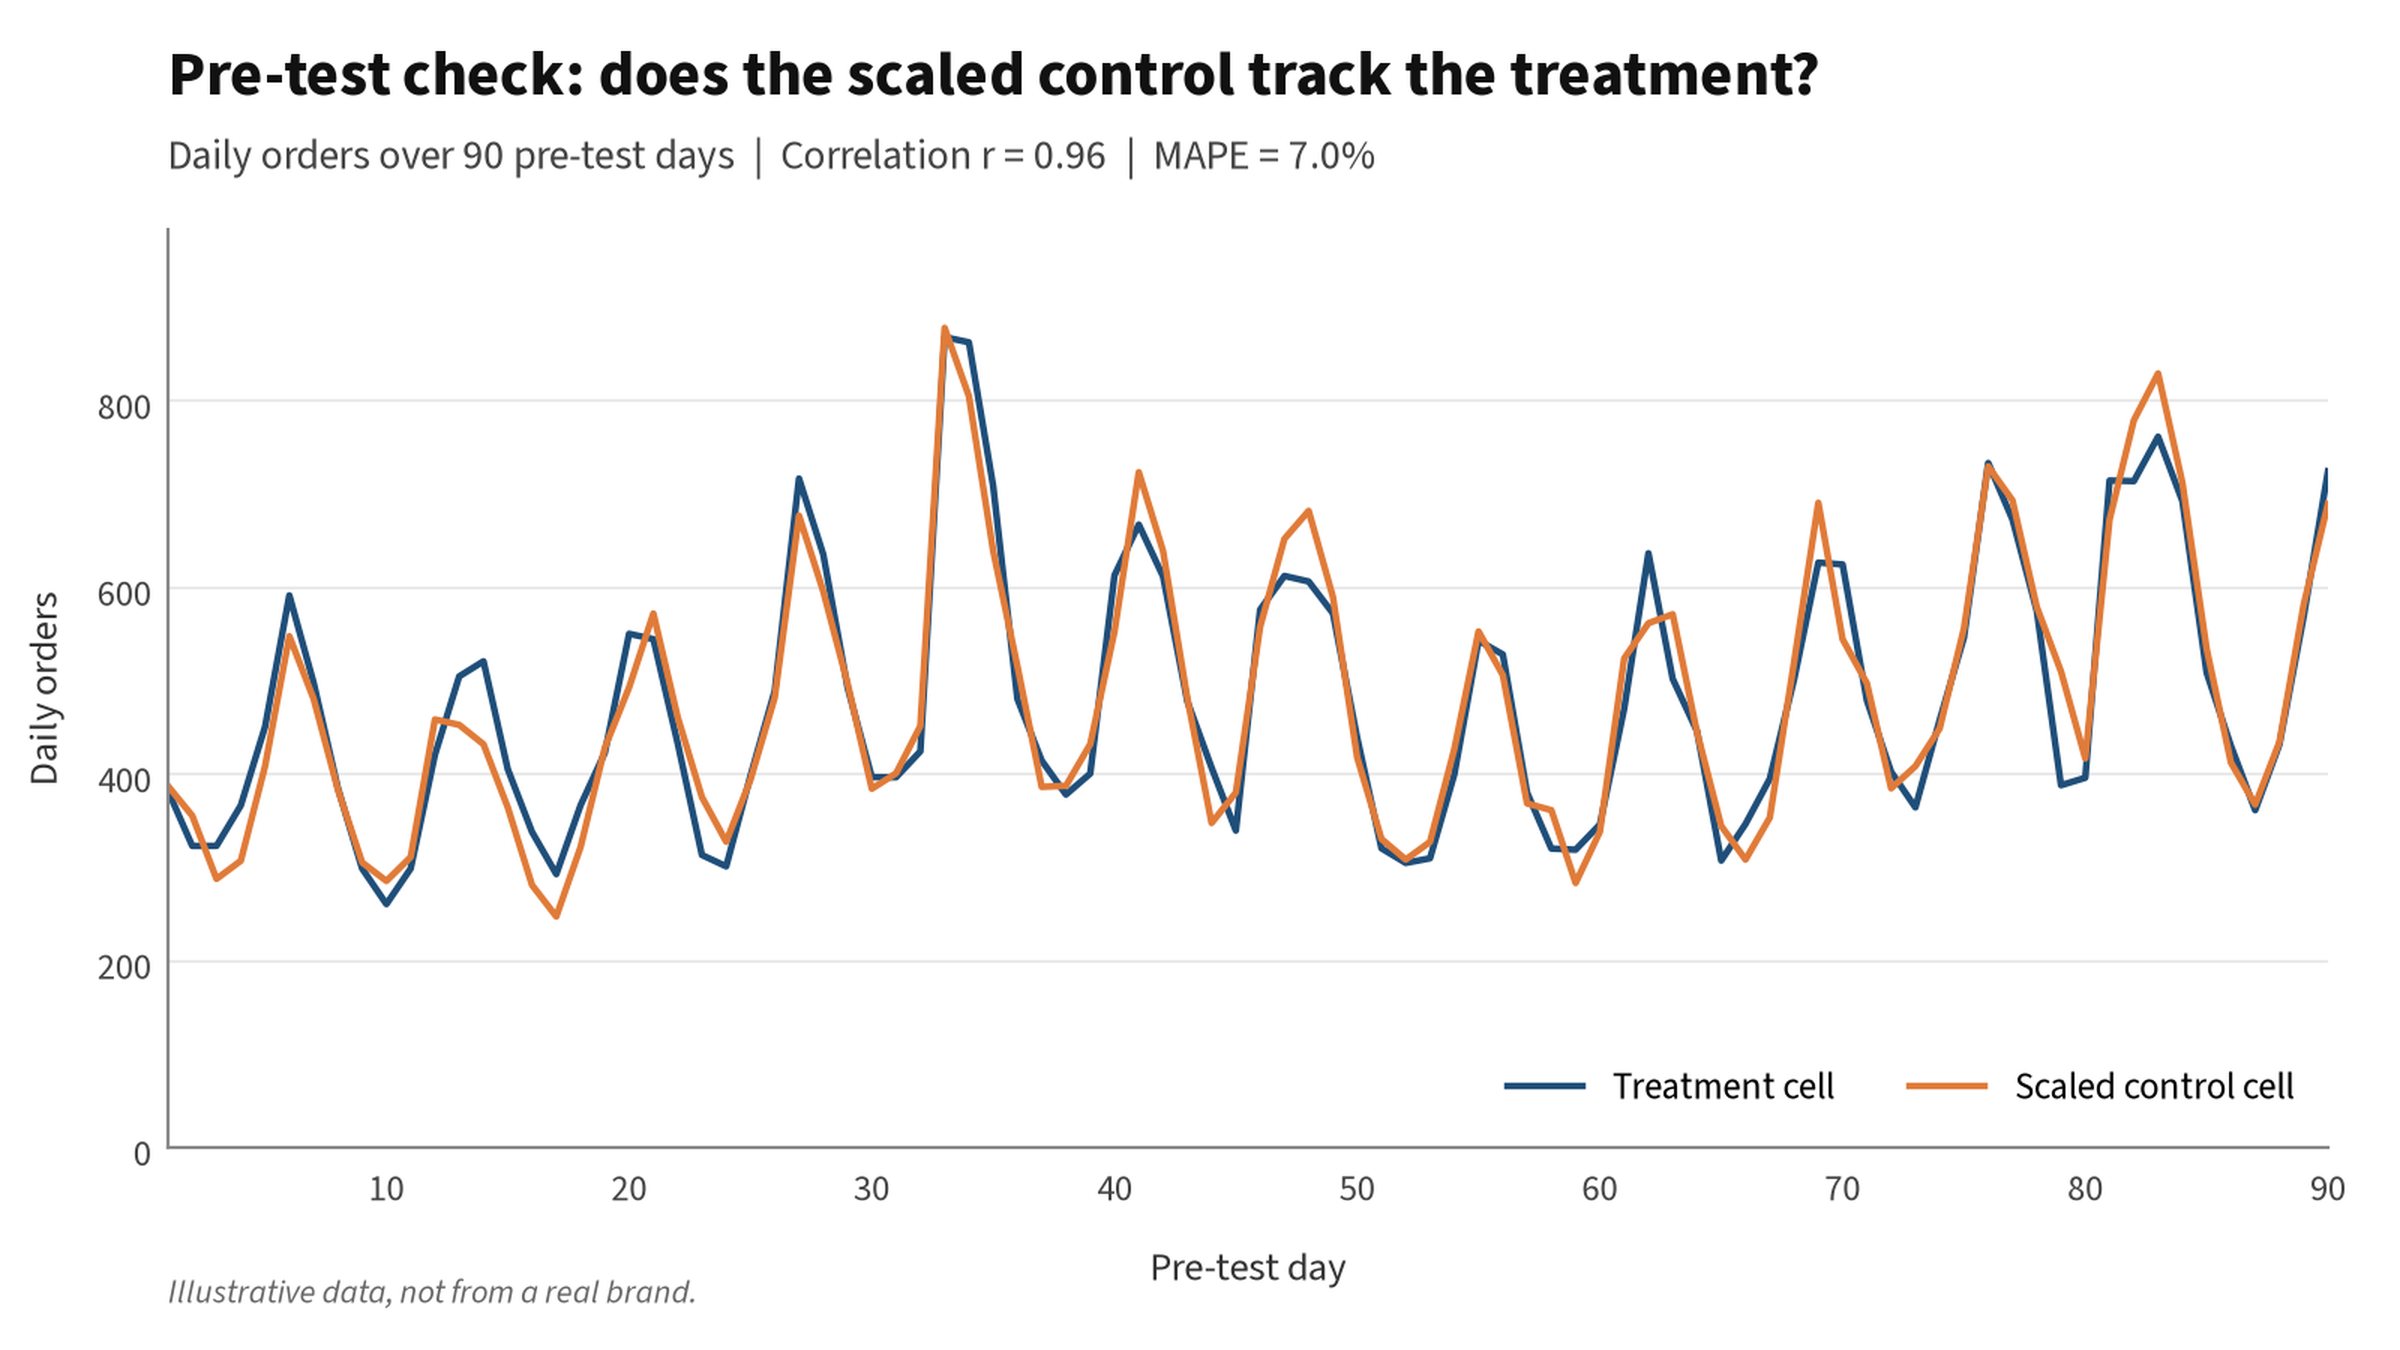
Pre-test check: does the scaled control track the treatment? Daily orders over 90 pre-test days, correlation r = 0.96, MAPE = 7.0%. Illustrative data, not from a real brand.
Does it pass a dry run?
Using your back data, ask your AI to check for lift between your cells in a time period that wasn’t used to generate your groups.
You should have close to zero lift. This would mean you’ve successfully picked areas of the country that can predict each other’s performance.
This is called an “out of sample” test. It’s especially important for a synthetic control.
Check | Target | If it fails |
Correlation (daily and weekly order volume) | At 95% or higher, even over six months or longer | Rework the cells or run a longer test |
MAPE of scaled control | Below 10% | Plan a bigger spend difference |
Out-of-sample dry run | Close to zero lift in a period not used to build the cells | Pick different geos or try another method (matched market or synthetic control) |
All that’s left to do now is introduce a radical change to one of those areas (your treatment). So, you can use your control group to see what would have happened without that change!
Check 2: How much spend do you need?
You know that if you spend $1, a customer might see your ad and purchase (how incremental!). But when comparing your cells, how will you know for sure that one more customer was because of spend and not just noisy data?
You need to spend more than $1.
How much more?
Tell your coding agent you want at least a 90% confidence score and an 80% power level score over a period of at least four weeks.
It will run a series of calculated tradeoffs. It will find out what amount of sales lift sustained over what period of time in your treatment is verifiably not noise. This is the minimum detectable effect (MDE).
When you know your MDE, you can estimate your needed spend by inserting your target efficiency.
Example:
My target for any channel is 2.5x incremental return on ad spend (iROAS). The MDE for my cells is a 15% average lift for 12 weeks. In other words, if YouTube caused my treatment geos to go up by an average 15% over 12 weeks, its impact would be clear.
Assuming I am going to get a 15% lift and at my hoped-for 2.5x iROAS, I can plan on spending 15% of all my treatment-cell sales over the life of the test, divided by 2.5.
It’s worth saying that this budget is based on a minimum confirmation and a home run performance. If YouTube performs lower than a 2.5x, and you spend the minimum required to see a 2.5x impact, you may not be able to clearly confirm whatever halo impact it might really have.
But the lesson there could be good enough: you either prove YouTube is a home run, or you failed to prove that it’s a home run. You don’t really have to prove that it was a foul ball.
Check 3: Can you act on it??
It’s extremely helpful to chat beforehand with decision makers.
And as you’ve seen above, if the spend is too low ($1), the effect may be real (one new customer) but be unprovable (doesn’t escape the comparison noise). Just because you can’t prove a success doesn’t mean you’ve proven that $1 doesn’t work.
If your goal was to get in the weeds on spend levels, guess what: more tests designed for those questions! This may mean differently sized or longer tests.
You could design a spend levels test with $0 vs. normal spend vs. much higher spend.
The first step is getting into your data and seeing what your data says!