Editor's note: Kristin Cavallaro is a knowledge and data analysis specialist at SSI, Shelton, Conn.
The online panel environment can often seem hostile. The avalanches of survey invitations, the agony of rejection, the dangling of the carrot and the often long and daunting surveys all weigh on the strengths of our panelists. According to the theory of adaptation, panelists should adapt and overcome these hardships.
In 2009, the issue of panel tenure was a hot topic. SSI and several leading market research companies conducted research which concluded that there were significant differences between new and tenured panelists.
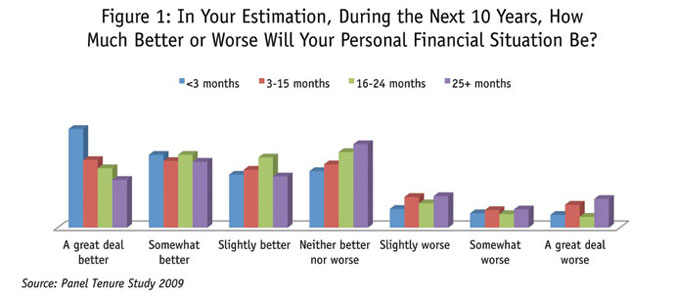
This was especially visible when looking at concept testing and propensity-to-buy questions. New panelists seemed to be more eager and more positive in these types of questions. The new panelists were more positive across a variety of different topics. An example from this research can be seen in Figure 1.

In 1864, Herbert Spencer coined the phrase “survival of the fittest” after reading On the Origin of Species by Charles Darwin. With this phrase, Spencer conveys that only those “fit” for a specific environment will survive. Could this in fact be the case in our panels? Does the panelist change over time, adapt to their new surroundings, if you like, or is it simply that only those who hold particular views survive the panel experience? Are they the fittest? New research from SSI examines this phenomenon.
In some experiments you see results straightaway; for this one we simply had to wait. In January 2011 SSI conducted a survey that collected over 2,000 interviews from the SurveySpot online panel. One year later we identified 770 panellists from that 2,000 who were still active. We invited these 770 to take the same survey again. We also included a sample of fresh, new SurveySpot members to also take the survey.
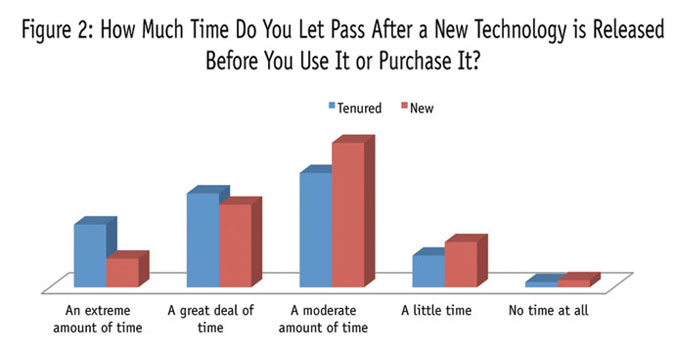
Just to be sure that the “problem” still exists, we also tested the hypothesis of tenured panelists being different from new panelists again in 2012. (For the purposes of this article, we define new panelists as those who have been on the panel for less than six months and tenured panelists as those who have been a member for more than six months.) As expected, based on what we saw in our 2009 test, we found differences in the answers from new and tenured panelists throughout our questionnaire. For example, new panelists tend to be quicker technology adopters than tenured panelists (Figure 2). In this example, 51 percent of the tenured panelists responded that they let a great deal or extreme amount of time pass by before purchasing new technology compared to 36 percent among newer panelists.
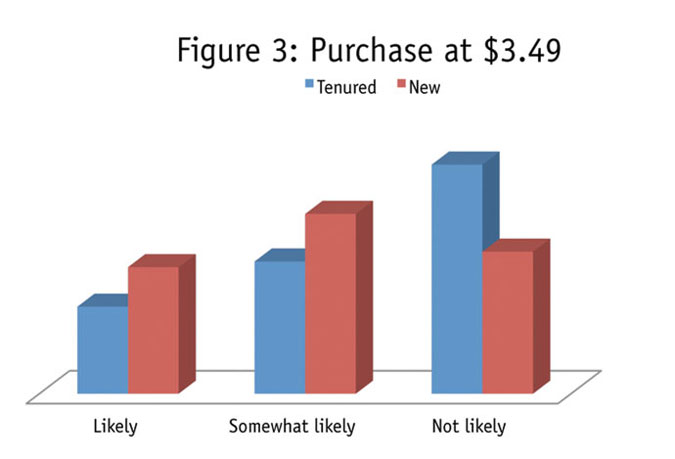
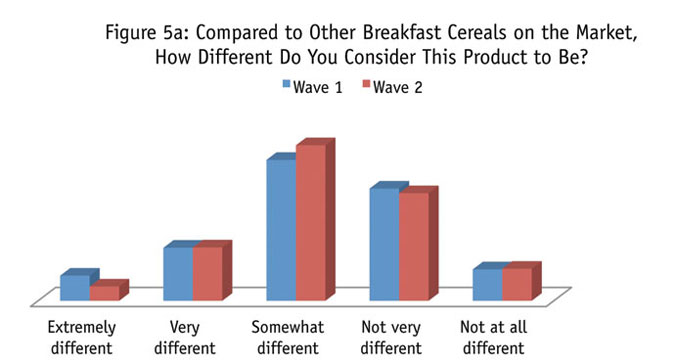
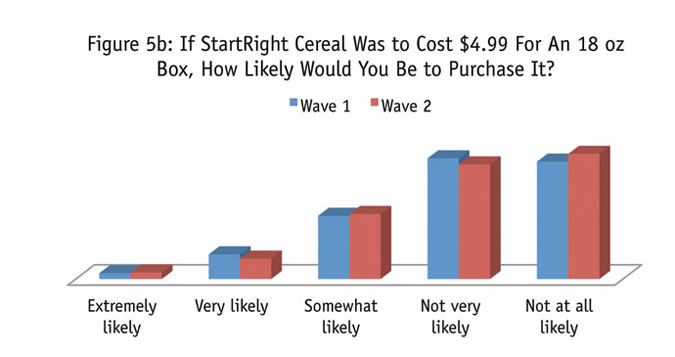
Differences are also evident with concept testing. SSI tested a mock concept for StartRight cereal. The first question asked how different the concept was. There was no difference in how tenured panelists answered versus new panelists. However, when it came to purchasing the cereal, the new panelists were much more likely to purchase it at any price point than the tenured panelists (Figure 3).
There were also attitudinal questions throughout the questionnaire. In nine out of 10 of the psychographic questions, the tenured panelists differed from the new. For example, when we asked if panelists viewed themselves as quiet and reserved, the tenured panelists were much more likely to agree with that statement.
So the $64,000 question remains: Did the tenured panelists change their minds over the year or did these people always think differently? To find out, we examined the answers given by individual panelists to see if they were consistent between the 2011 wave and the 2012 wave.
While we wouldn’t expect everyone to answer exactly as they did a year ago, especially on soft measures using scaled questions, 60 percent of the tenured panelists did answer the same. This included attitudinal questions, reactions to concepts, ownership and more. We would expect things like ownership of small electronics to change over time since these markets are growing each year. Likewise, our cereal concept, while maybe new and different a year ago, has become more common.
Typically when we use scale questions in our questionnaires, we are not looking at the responses of each scale item. Rather we are looking at an aggregated version that, for example, combines “strongly agree” and “slightly agree” into “agree.” When we do this, the percentage of those answering similarly jumps to 70 percent. What happened to the other 30 percent? Well, most of the 30 percent change their answer to a neutral option in the scale questions or their ownership or behavior changed. For example, how many people still carry around a portable CD player? There are still some people out there, but as time passes, people will trade in their CD players for more efficient MP3 players. In fact, we saw 14 percent of those who answered yes last year to owning a portable CD player now said they don’t have one. Does this mean that our panelists are changing? If so, they are changing with the market, not with their tenure.
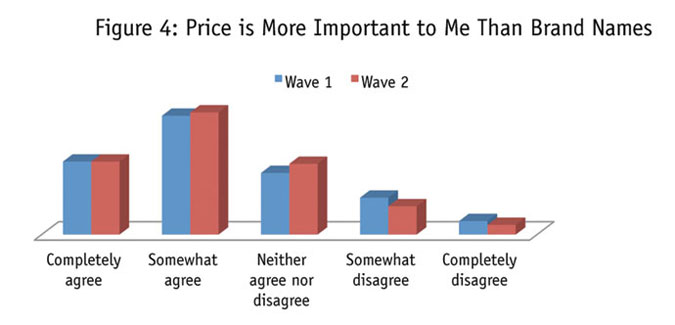
When we look at all the data side by side from the 2011 wave to the 2012 wave, we see no difference. For example, when asked how much they agree or disagree with the statement “Price is more important than brand name,” we saw no difference in responses (Figure 4).
The 2011 research had shown that tenured panelists tend to be less enthusiastic about concepts than new panelists. We saw the same results again in the 2012 research – but this is not because people have changed their opinions between wave 1 and wave 2. People are not changing their response behavior just because they have been on the panel longer (Figures 5a and 5b). That’s just the type of person they are.
When we found that people are not changing their opinions over time, we began to scratch our heads a bit. Why then are new panelists so different from tenured panelists? To better explore this, we looked at the original responses from the 2011 data of those panelists who are no longer on the SurveySpot panel. There were approximately 1,500 panelists from the original 2011 study who are no longer members.
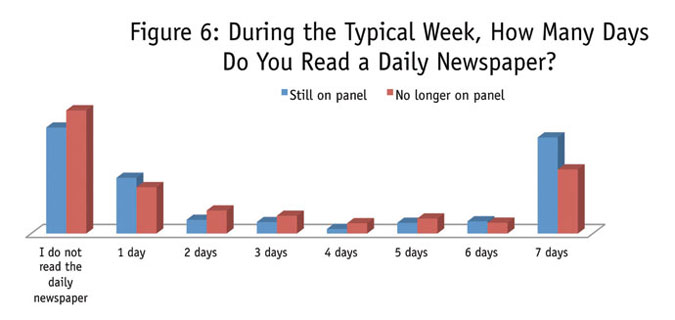
When we compared the data of those who are still on the panel one year later to those who are no longer on the panel, we see differences on almost every question spanning a variety of topics. For example, when we asked panelists how often they read the daily newspaper in a typical week, we see that the panelists who remained on the panel after a year are much more likely to read the newspaper every day than those who have left (Figure 6). (Note: In this comparison, the data was weighted on age and gender.)
So what does this mean? It appears that the type of person who is willing to stay on a panel for any length of time is different from the type of person who only stays for a short period. The reasons why this is so and exactly how the two groups are different will be an area for further research as this next batch of respondents is revisited a year from now. Is it possible to identify certain traits that allow us to determine early on which people will stay on a panel and which will leave?
And, does this mean that we should quota on panel tenure? No. Based on the theory from Disney’s The Lion King, this is all part of the great circle of life. As panelists fall away they are replaced with new panelists. Some of these new panelists will be able to survive the panel environment while others will come and go. As long as the panel continues to source in the same manner, a natural balance should occur. The same is true with using a multisourced approach. As long as the methodology behind the recruitment is consistent, a natural balance of tenure and of personalities will occur in the sampling environment. This is especially so when the sample-blending approach goes beyond traditional demographics into a more psychographic-based model of balancing.