
Leveling the playing field
Editor's note: Peter M. Gold is CEO and Jordan M. Losen is president of VeraQuest Inc., an Armonk, N.Y., research company.
 When charged with the task of determining a winning concept (e.g., product or advertising concept, positioning statement, product claims, etc.) to bring to market among two or more options, marketers and researchers have several methods from which to choose. The most robust of these is the monadic-cell test design, where respondents view and provide feedback about only one concept. It’s considered superior methodologically to other research designs because it eliminates the possibility of the “halo effect,” where consumers’ responses to one concept are impacted by their exposure to other concepts.
Once the decision has been made to go with a monadic design, it is important to ensure that the design is implemented properly. While the first step is to randomly assign respondents to two or more cells, we cannot rely on randomization alone to ensure that our cells are comparable. Sample-balancing is the art and science of creating and applying weights to respondents so that any conclusions being drawn from the test are based on the concepts themselves and not the underlying sample composition of the cells.
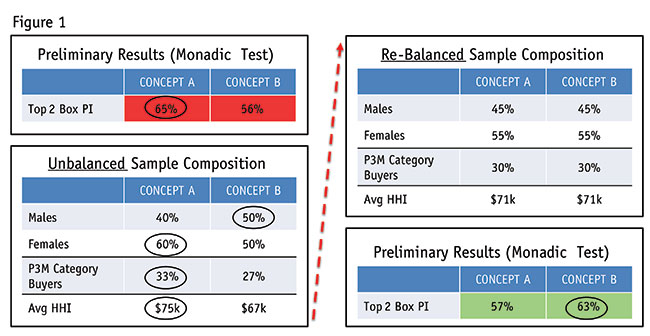
Figure 1 is an example of how improperly balanced cells could have led to an incorrect conclusion, which in turn could have led to a poor business decision. In our example, where Concept A and Concept B go head-to-head, Concept A appears to win out. Since there are 250 respondents per cell, the difference was statistically significant. However, when we broke down the sample, we saw that Cells A and B were fundamentally different: Cell A had a higher proportion of females, had households with higher incomes and contained more category buyers than Cell B. Asymmetry in any one of these characteristics could have been enough to skew the results. Moreover, this type of sample imbalance can occur even when respondents are randomly assigned to each cell. The upshot is that once proper weights were applied so the cells were balanced on gender, income and prior category purchasing behavior, the results flip-flopped. The clear winner, statistically, became Concept B not A.
There are several steps involved in properly balancing samples after data are collected in a monadically-designed research study. A comprehensive explanation of every step is beyond the scope of this article. Below, however, are some guidelines.
Step 1: Apply general weighting first
The weighting procedure in sample balancing often involves a two-stage process. For many studies, there is an initial general weighting scheme that is used to make the data representative of the relevant population. It might consist of demographic weights from the general population (e.g., age, income, region, etc.) or it could involve some type of study-specific weighting scheme – pet ownership for example. In either case, these general weights are applied before starting the sample-balancing process. That said, there are times when the overall target weights are not known, making the construction of a general weighting scheme impossible. In those instances, we move directly to the task of sample balancing.
Step 2: Identify which respondents actually will be included in the sample balancing task
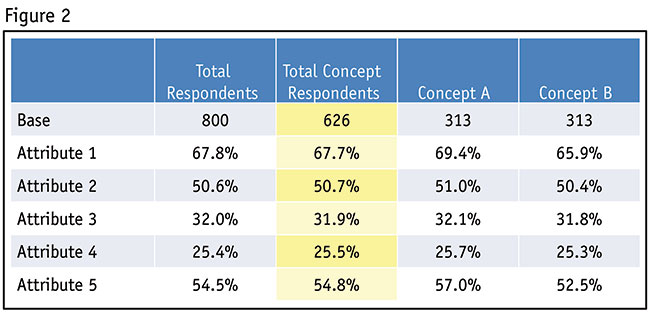
The next phase of our discussion deals with the setup of the data tables to help us carry out the sample-balancing process (Figure 2). We recommend creating two “Total” columns. The first is a “Total Respondents” column and the second is a “Total Concept” column. Both totals will be necessary as some of the respondents who may qualify to participate in a study might not qualify for the concept-testing phase of the study. We need to use the data in this second column, the Total Concept Respondents column, to create the sample balancing weights.
Step 3: Selection of critical sample balancing variables
In theory, too much of any one characteristic (i.e., age, gender, income, education, category affinity, etc.) within a given cell could undermine the accuracy of the entire test by making the respondents in that cell more or less predisposed toward a given stimulus. However, it’s also not feasible to sample-balance on every conceivable characteristic. Therefore, we need to identify a hierarchy of characteristics to balance on based on those that are most likely to impact results.
It usually makes sense to start with behavioral variables such as past category or brand purchasing behavior as they are the factors most likely to influence one’s future purchasing behavior. For example, let’s assume Heinz is testing two new ketchup bottles: Bottle A and Bottle B. It stands to reason that Bottle A would generate greater purchase intent than Bottle B if the respondents assigned to review Bottle A had a higher concentration of ketchup buyers. Likewise, Bottle A would likely generate greater purchase intent than Bottle B if the respondents assigned to Bottle A contained a higher concentration of Heinz buyers.
It’s worth mentioning that any sample-balancing characteristics based on behavioral questions such as category or brand usage should only be utilized when asked prior to the stimuli’s exposure. Seeing the stimuli before the behavioral questions could influence how a respondent answers the purchase behavior questions, thus rendering those variables unusable for the purpose of sample balancing.
Next come demographic characteristics. Here are some things to consider: Is gender a determining factor in who buys the product? What about geography? Region of the country is often a critical criterion as tastes can vary dramatically based on where someone lives. Income can be a vital characteristic if an item’s cost comes into play. There are no hard and fast rules about which demographic characteristics are included in the sample balancing equation. One needs some knowledge of the category and a measure of common sense to identify the demographic characteristics to be used to create sample balancing targets.
 Step 4: Generating the weights
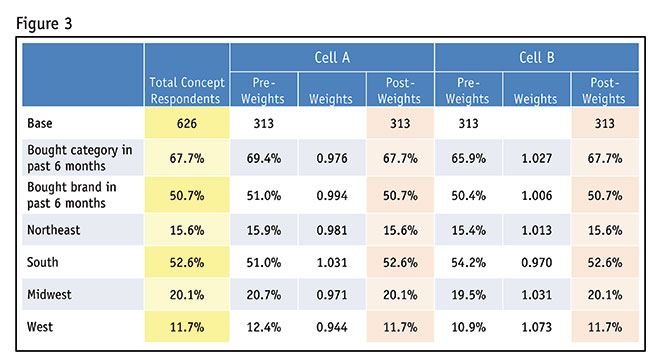
The percentages in the Total Concept column will be the weighting targets. Weighting factors for each cell are generated by dividing the target percentage into the actual percentages for each cell.
The following example uses data from Figure 3 to show how the factors are generated:
Northeast
Cell A: 15.6% ÷ 15.9% = 0.981 adjustment factor
Cell B: 15.6% ÷ 15.4% = 1.013 adjustment factor
The data processing department then incorporates the adjustment factors into a “best fit” algorithm, which identifies the ideal factor for each respondent which will meet the balancing requirements, while minimizing the amount of weighting required.
Step 5: Double-checking
As with any procedure where there are multiple steps, mistakes can happen anywhere along the way. It always makes sense to look for red flags that signal that something has gone wrong during the sample-balancing process.
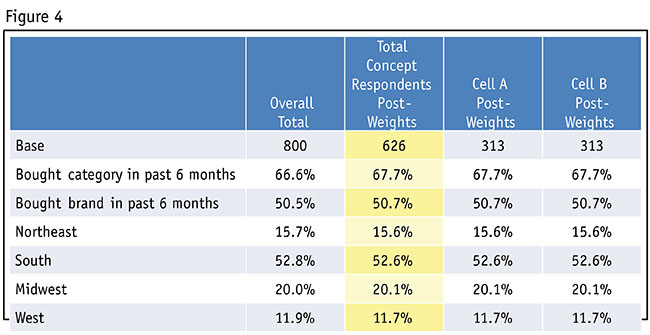
While any of the percentages in any given cell may shift up or down due to the applied weights, the percentages in the Total Concepts column should not change as they represent the target percentages (Figure 4). Therefore, we should check the percentages pre- and post-sample balancing to make sure they do not differ. In fact, the pre- and post-percentages should be nearly identical. Variances of more than 0.2 percent between the two suggest there is an error.
An important step
The steps provided in this article paint a fairly broad framework on how to conduct sample balancing. The actual process is more nuanced and, as mentioned earlier, beyond the scope of what we can realistically offer here. The key takeaways are 1) that sample balancing is an important step when comparing results when stimuli are being tested and compared across independent (monadic) samples, and 2) that whoever you use to employ the sample-balancing procedure should have the knowledge and experience to implement it correctly.