Editor’s note: Matthijs Visser is a principal consultant at Advanis, an Edmonton, Alberta-based market and social research firm. This is an edited version of a post that originally appeared here under the title, “A case for IVR.”
IVR data collection continues to surprise me. Before explaining why, let’s take a step back and let me quickly explain what data collection via IVR looks like. An IVR survey consists of a series of pre-recorded questions, administered via phone. As an example a, “likelihood to recommend” question could be asked as follows:
How likely would you be to recommend [brand X] to a friend or family member on a scale of one to five, where one means “Not at all likely to recommend” and five means “Extremely likely to recommend?” Please press any number between one and five.
Administering a survey via IVR is a highly cost-effective approach when reaching out to respondents via phone is needed (e.g., when no e-mail address is information is available for respondents). The question that usually comes up though is what response rates we’re seeing for IVR surveys: Doesn’t everyone hate these automated calls? Are respondents at all willing to do a survey via IVR?
And this is where the IVR continues to surprise me. As it turns out, respondents are quite open to completing a survey via IVR and for some demographics in particular, the response rates are actually quite staggering.
Here are some of the studies that convinced me of IVR’s ability to reach and engage respondents:
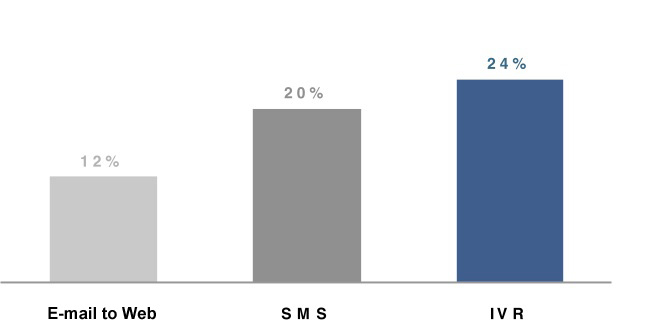
On one of our studies, we executed three data collection methodologies side-by-side: e-mail-to-Web, SMS and IVR. The survey pertained to a recent visit to a retail store and the SMS and IVR methodologies reached out to respondents on their cell phones. The response rates (calculated as completed surveys/everyone invited) we saw were as follows:

Across the three data collection methodologies, the IVR obtained the highest response rate.
Certain demographics are more receptive to the IVR methodology than others though. To illustrate, on one of our studies we gave respondents different options for completing the survey, as follows:
- On day one, we sent respondents a text message that invited them to do the survey via SMS or via a mobile-optimized Web survey.
- On day two we gave those who hadn’t responded to the invite a follow-up call via IVR.

So while SMS is, not surprisingly, most popular among younger demographics, the IVR is most popular among older demographics and in particular among individuals 65-years-old and older.
In light of this, an example of the application of the IVR methodology is on a study for a home health care provider, whose client base consists largely of older demographics. On this study, we follow up with clients who recently received a call from the provider or who called the provider. The response rates here look as follows:

So depending on the service and the type of call the client made or received, the response rates we are seeing can be as high as 50+ percent.
One last powerful application of the IVR methodology is to access low-incidence populations. Trying to reach these populations using live interviewers can be quite cost-prohibitive. We have leveraged the IVR methodology to reach a wide range of low-incidence populations, such as smokers, home health care users and gym members.
The IVR methodology proves to be an effective and cost-effective methodology, in particular in cases where:
- the survey is short, e.g., for customer experience measurement programs;
- phone contact information is more readily available than e-mail information;
- target respondents less tech-savvy (e.g., older demographics); and
- the target population’s incidence is low.