Fielded in the summer of 2015, this edition of our corporate researcher work life survey tackled a range of topics identified in consultation with some wonderfully helpful Quirk’s readers: budgets; techniques in use and under consideration; how they seek buy-in for new MR tools; how they deliver results; outsourcing; internal views of the insights function; vendors; and the impact of big data and other non-MR-gathered data sources. We received 691 usable responses.
As you might guess, the vendor-related responses ended up meriting their own section but let’s dive into the data on the other topics.
Budgets appear to have held steady for 2015, with 44 percent saying their spends stayed the same as in 2014 and about equal numbers reporting some sort of decrease (25 percent) or some sort of increase (30 percent).

The story is similar for the amount allocated for outsourcing marketing research, with 46 percent saying things have stayed the same in 2015 and an aggregate 22 percent citing a decrease and 31 percent citing an increase.
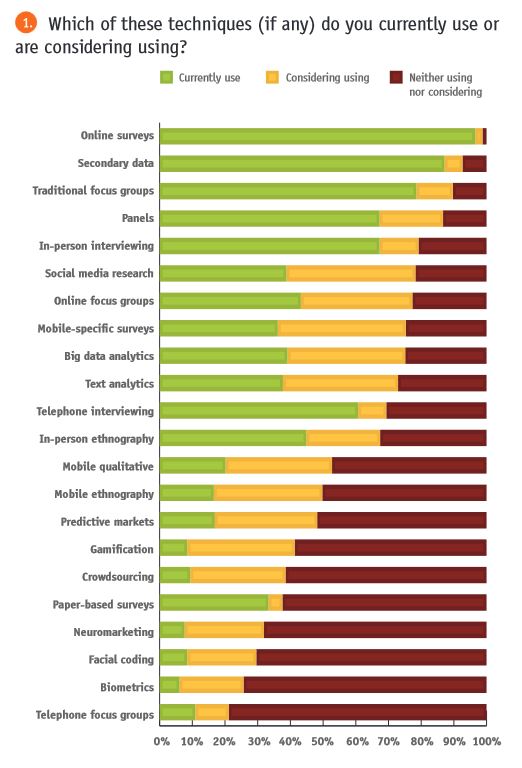
As we have found with previous Quirk’s reader surveys, while the omnipresence of terms like disruption and innovation at industry gatherings makes it seem like the use of longstanding research methods is (or should be) declining, results from this year’s study show stalwarts like traditional focus groups and secondary research as still in wide use. Even telephone interviewing makes a respectable showing, with 61 percent saying they currently use it. At 97 percent currently using, online surveys are clearly a go-to method. Up-and-coming methods like big data analytics, text analytics, mobile ethnography and gamification all garnered respectable (30 percent or above) percentages of respondents considering using them while non-conscious methods like neuromarketing research, facial coding and biometrics have consideration percentages in the 20s.

The seemingly least-popular method is the telephone focus group, with 79 percent of respondents saying they neither use the method nor plan to use it. The aforementioned non-conscious methods come next: biometrics (74 percent); facial coding (70 percent); and neuromarketing (68 percent).
While the death knell for focus groups has been louder than ever in recent years, someone forgot to tell the respondents to our survey: a combined 91 percent cited traditional focus groups as effective or very effective at delivering actionable insights. Also clocking in with high combined effectiveness numbers are online surveys, in-person interviewing, secondary data, panels, in-person interviewing, in-person ethnography and telephone interviewing. Again, the non-conscious methods have the highest “not sure” percentages.
To add some color to the questions about usage levels and perceived value and impact, we asked an open-end about the technology, tool or technique that has had the biggest impact on respondents’ deliverables in the past year. Some sample responses:
"I would say techniques in the communication of outputs, rather than research techniques alone. We’ve done a lot more with visual deliverables – quotes, videos, stories, magazines, etc., rather than traditional market research deliverables. It helps spark and engage attention and discussion.”
“Structural equation modeling is not new but was new to me this past year. It allowed us to understand our customer subgroups and their differences in a way I had not done before.”
“Data synthesis – moving from a ‘study mind-set’ to one that leverages multiple primary studies and a host of other sources to provide deeper insight.”
“Utilizing in-software reporting instead of developing customized reports from analyzing data outside of the survey software (for basic frequencies). We [used to] spend a bunch of time formatting and inserting data from analysis software into reports and that took time away from seeing the story. We want to spend time finding the insights, not checking numbers.”
“Biometrics – enabling better diagnosis of content and optimized media.”
“Combining information from qualitative, quantitative and secondary to form a coherent picture.”

Can’t do it all
As multifaceted as most researchers are, they can’t do it all and when asked about outsourcing, most (85 percent) respondents said they outsource some of the work involved with the MR and insights function. Not surprisingly, data collection (90 percent) is the most-cited part to be outsourced, followed by respondent recruitment (82 percent) and data analysis/tabulation (75 percent). As to why they outsource, a lack of internal staff (81 percent) was most-cited, followed by being able to provide an expertise that isn’t available in-house (66 percent) and a desire for faster turnaround (41 percent).

An analysis of responses to an open-end about the reasons for outsourcing uncovers several themes. Many of those who completed the survey are one- or two-person teams who are beyond busy (“We support a several-billion-dollar biz so we can’t do everything in-house.”) but smart enough to know that outsourcing frees them up to do more valuable work (“We can create value at a different place and see ourselves much more as business partners and not as pure researchers.”), gets them out of the political crosshairs (“[By outsourcing] sometimes we benefit from the ‘consultant effect,’ where if someone external says something, management may be more likely to believe it.”) and often saves time and money (“Much faster and cheaper to have an external firm handle this for us.”).

Many strategies being used
While the buzz around new research methodologies may be out of proportion to their uptake, they certainly hold promise and for the researchers who want to secure internal buy-in for trying them, the study shows many strategies are being used. Asked about the effectiveness of various ways to make a case for using new methods, respondents cited things such as a track record of past success with new tools and techniques or a case study from another firm using the tool or technique as effective.

When it’s time to deliver research results, written and in-person approaches are most popular, through small- and large-group presentations and informal meetings, with far lower percentages for infographics (36 percent), using the company intranet (34 percent) or an enterprise-wide dashboard system (21 percent).

“Our reporting varies by internal stakeholder group. For IT collaborators and select product line owners it may be a video report with PowerPoint slides to serve as a later punch list for developers. In some cases, it is PowerPoint only with heavy images for TV-like monitors. Sometimes due to verbatims, it is back to the good ol’ Word document. We are trying to do more eight-to-12-minute video-based reports for all stakeholder groups.”
“We like to send super-brief (one-minute) summaries to all senior leaders when we derive useful insights, which can spur additional questions (and requests for new research engagements).”
“We’ve found it best to use any and all ways to deliver insights. Depending upon the intended audience, one way may work better than another and therefore we need to be flexible.”
“Our company does open-invitation events and we have had the opportunity to present at several of these. The events are open to anyone who wants to attend and so it is a good way to provide information across the enterprise without having to go through management-chain dissemination.”
“We also incorporate business strategies into the research findings to provide both the learnings and what to do about it.”

Gets excluded
Despite researchers’ best efforts to package and promote the work of the insights function, there are instances where the research department gets excluded from important business decisions. Our survey asked respondents to choose from a list of potential reasons for this happening. At 62 percent, lack of awareness of the insights function’s capabilities was the most-chosen, followed by stakeholders using other internal data to understand the business issue (43 percent) and stakeholders not seeing the value of gathering customer feedback (41 percent). The internal view that the insights function is too slow (38 percent) and a stakeholder preference for DIY research methods (26 percent) round out the list.
Probing deeper, we asked respondents to elaborate on some of the reasons their departments were not included in the decision-making process. A handful of respondents said this situation hasn’t been a problem for them (“Our group is highly valued within our organization and consumer insights are at the heart of our decision making.”). For those who have experienced it, many of the comments referenced higher-ups wanting to go with their gut or being afraid the research findings will refute their beliefs. Others mentioned the insights function being bought into the process too late in the game.
“In our environment, to save money everyone does DIY research. Some days it is incredibly discouraging but when our clients ‘get it,’ they really ‘get it’ and the results are amazing. We’ve been able to show that the difference between a successful product launch most of the time is whether they used insights to inform their decisions. Those that did had much better results.”
“Sometimes decision makers think that big data tells them everything they need to know. They eventually regret it and ask for our help.”
“Relying on consumer research is often regarded by the C-suite as the business team not being willing to take risks and capitalize on their own instincts. Historic financial data (performance correlations) are deemed more important than consumer insights (brand attitudes, beliefs and opinions). If stakeholders don’t see/experience/hear it for themselves, they don’t believe it.”
“I take a strong dislike to how this question is framed. We don’t get a seat at every table at which a decision is made – for a million reasons that have nothing to do with us or our value. Sometimes a project needs to be incubated or confidential or they are looking to build up support/unpack an issue in an intimate fashion. Anyone who works in a company with a functioning stage-gate process has a chance to have their voice be heard. So what is implied here? That one is upset not to be engaged going into a stage-gate recommendation? So is that about you and your personal desire for control or meaning? Or about the team? Of course they won’t see every opportunity to engage you. It’s our job to make the most of the voice we have.”

Incorporate other types of data
Another hot-button issue in our industry is whether the proliferation of non-research generated data sources will end up complementing, subsuming or eliminating the traditional insights-gathering function. The survey asked respondents how often they were being asked to incorporate other types of data (transactional, operational, social media-generated, etc.) into their projects and nearly half (45 percent) said “sometimes” and 27 percent said “most of the time.”

Next, they were asked how likely they felt it was that these data sources would render the research function unnecessary. Forty percent said they felt it was very unlikely and 43 percent said it was unlikely.
Again, the comments accompanying this topic are illuminating, showing a belief in and confidence around the role that research plays within their organizations (with a few exceptions!).
“My internal stakeholders don’t have research expertise – nor do they want to. That’s what I was hired for and they trust that I know what valid sources of data are available.”
“My internal stakeholders don’t have research expertise – nor do they want to. That’s what I was hired for and they trust that I know what valid sources of data are available.”

“We incorporate those data sources gladly. It only makes our reports and insights more actionable and informed.”
“This is a great question. We’ve felt the pendulum start to swing in the direction of big data – however we’ve made a concerted effort to provide insights even when they haven’t been requested and by doing so have kept custom research relevant. A video clip of a consumer saying the same thing that thousands of transactional records will prove still has breakthrough power and weight. Proactively providing what we haven’t been asked for has helped us stay relevant to the point where the pendulum appears to have swung back to its midpoint.”
“The world is definitely moving toward behavioral information or big data because it’s already available and it’s cheaper. While we haven’t mastered the analysis of it yet, I do worry that management is moving toward using that more than primary opinion data from the consumer. This is a battle that I fight every single day – why behavioral data does not tell the full story of the consumer mind-set and we need both data sources to fully understand our business. I don’t feel that research companies are fully aware of this change. It’s getting more and more difficult to fight this battle against the obstacles of falling budgets and the easy availability of other data sources.”

“The problem is when transactional data contradicts the market research conclusions. Or the research data comes to the same conclusions at a higher cost and much later. Funding will increasingly favor big data solutions.”
“There are certain questions that you can only answer if you ask. These other data sources can only approximate the answers.”
“Big data can tell us WHAT but it can rarely tell us WHY. Big data tells us a user spends 2.5 minutes on a Web page but is it because the page is so compelling or because the page is so confusing? That’s where marketing research wins: It adds the context. And in a day and age of abundant data, context has never been more important than it is now. Perhaps MR practitioners need to rename themselves: context providers (ha).”
Context providers, eh? That actually has a nice ring to it.

Note: The corporate research report work life survey was conducted online from June 25 to July 14, 2015 among pre-qualified corporate marketing research (client-side) subscribers of Quirk’s. In total we received 810 responses from which we had 691 usable qualified responses. An interval (margin of error) of 3.7 at the 95 percent confidence level was achieved. (Not all respondents answered all questions.)