Voice is the new data
Editor's note: Danica Allen is global director of consumer experiences strategy at research company GfK.
For businesses engaged in the development of new products or services, there are risks wherever we look. On the one hand, there is the opportunity cost of not developing a product that could hold huge potential. On the other, there is a profound, real cost – both time and money – when flawed products and services are launched and fail.
Fundamentally, consumers adopt new products and services that improve their lives. Consider the iPhone. It began as something convenient – a single device that could substitute for a camera, watch, roadmap and phone. In time, however, people came to identify with their iPhones; the device began assuming central roles in many key life activities and an emotional connection was built.
In their widely-praised book Built to Love, Boatwright and Cagan emphasize the crucial role that emotion plays in product success. Drawing on a multiyear study, the authors provide empirical evidence that brands with higher levels of emotional attachment among consumers also thrive economically. Even when “superstar stocks” such as Apple and Google were removed, high-emotion firms outperformed others by 800 percent. And during the post-2007 economic downturn, high-emotion stocks dropped at a lower rate than their competitors.
The enormous question on the table for manufacturers, service providers and other brands is how to identify product concepts that have high probabilities of building deep emotional connections with consumers – the pinnacle of product success. Which concepts are most likely to engender the positive emotional responses that will weather economic downturns and produce enhanced sales during upswings?
For researchers on both the client and vendor side, this leads to a related question: How can we better predict customer behavior by including emotion in our measurement systems?
Tempests in very old teapots
For decades, researchers have relied on multi-point scales to measure the sentiment of consumer opinion. These range from fully-anchored scales, wherein each number is assigned a label (such as “Somewhat Likely”) to endpoint-anchored versions in which only the two extremes are labelled. The argument over five-point versus seven- or 10-point scales has raged on for many decades but in the end, these were tempests in very old teapots, of relevance to a very few indeed.
The fact is, consumers do not talk about products using multi-point scales; they are unnatural modes of expression. Compared to scales, spoken or written language is infinitely more nuanced and – depending upon the speaker – able to convey extremely complex attitudes, feelings and emotions.
In one experiment, respondents were shown a random subset of 35 new product concepts and asked to rate each on a five-point Likert scale. They were subsequently asked to type out the rationales for their responses. From the scalar data, top-box purchase intent percentages were determined for each concept; and the open-ended responses (rationales) were subjected to a simple sentiment analysis. Out of the 35 concepts, the two measurement approaches agreed with respect to the best and worst performers. But the langauge-based sentiment metric yielded a coefficient of variation that was five times higher than the scalar method.
The unmistakable implication is that language – even when reduced to a single sentiment metric – is capable of identifying variability that would otherwise be obscured by the measurement itself. The unstructured responses captured emotions and opinions that the scales simply could not register, because only a few predefined, generic responses were allowed.
More granular, nuanced data
Now that we understand the relationship between products and services and the emotional connections they create with consumers – and therefore the probability that adoption/launch will be successful – how can we get more granular, nuanced data on the human side of product likes and dislikes?
While open-ended responses represent a tremendous resource for understanding consumer attitudes and behavior, limitations are also readily apparent. Typing is a skill, for example, that some people excel at and others abhor. The length and content of typed responses may well be a functlon of dexterity and comfort at the keyboard.
Written answers to questions also tend to be: standardized (via grammar and style) and therefore restricted; planned and polished (through editing and revisions); and compact, with fewer digressions and explanations.
Written prose tends to hide a great deal of context and development behind ideas and opinions; the finished product appears as if by magic, with all failed experiments deleted. The writer looks smart, indeed, but the reader or audience has much less to go on. And if we are looking for the warmth and vibrancy of emotion, the page or screen can be seen as truly a “cool” medium, in Marshall McLuhan’s terminology.
Verbal reactions have a number of advantages over typed responses. The most noteable difference involves the spontaneity of vocal responses; they have not been preplanned, rehearsed and refined. They are also less taxing on survey respondents, who may be amateur typists at best.
In addition, spoken responses tend to include: dialect variations; pitch, rhythm and stress; pauses and intonation; and unusual and possibly telling pronuncations.
In traditional survey and qual research, analyzing mass quantities of open-ended typed answers and/or recorded verbal responses was onerous. But new technology has made it much easier to extract the content and learning from such unstructured data. This recognition led to an experiment, conducted by GfK, that involved recording consumers’ vocal reactions to up to five new product concepts and then subjecting them to a transcription step that yielded a text file corresponding to the audio file. We then compared these results to traditional survey feedback on the same product concepts.
The results suggested that respondents who verbalized their reactions provided an average of 83 words per stimulus, while those who typed produced an average of just 14 words. Add to this the additional insight and information provided by inflection and other nuances and we can see there is a wealth of potential learning to be culled from a voice-centered approach.
For marketing researchers, audiometric data represents a radically different form of information. For example, modern recording technology uses a sampling rate of 41.4KHz. This equates to over 41,000 data points per second of speech! In our study, respondents spoke for an average of 30 seconds, which means each yielded about 1.2 million audiometric data points per new product stimulus.
Speech can be analyzed according to two key elements – what you say and how you say it. Detecting prosody – how something is vocalized – is a skill that all humans learn. We know, for example, that the words “I love you” can be said in a multitude of ways. The prosodic content of speech can drastically change the implications of these three words. How something is said can contain as much meaning as the words that are spoken.
In our experiment, the prosodic element of speech – arousal – was generated through acoustic signal processing. Parallel to the audiometric analysis that yielded arousal, we subjected the lexical content of consumer reactions (i.e., the transcribed words or text) to unique algorithms tuned specifically to identifying two constructs: activation and sentiment.
Most marketing researchers are familiar with sentiment analysis as a way to summarize open-ended comments. Activation, on the other hand, measures the likelihood that the respondent will act based on seeing the concept. Positive activation involves a respondent spontaneously saying they’d look for it or plan to purchase it or even tell a friend about it.
In the present case, our sentiment and activation algorithms were trained specifically to capture new product concept reactions. Neither model was based on “keyword searches” but instead utilized sophisticated machine-learning algorithms.
Integrating the three metrics
Quite simply, a respondent must spontaneously express 1) positive sentiment and 2) positive activation (desire to do something) 3) in a passionate way. As mentioned earlier, it is important to note that the passion metric is irrespective of valence. One can hate or love something passionately. This is critical to understanding the audiometric variable.
These three hurdles yield a subset of respondents who we believe represent the maximum trial potential for a new product. Failure on any one of the three criteria discounts the respondent with respect to the trial estimate. Clearly, this is a significantly more stringent set of criteria than are typically used in concept evaluation.
Acquiescence bias often leads to highly overstated purchase intent and often tenuous heuristic (or black-box) approaches to adjusting it based on presumed cultural biases. Cross-cultural situations can be especially problematic since it is well-known that respondents in some countries yield highly skewed distributions.

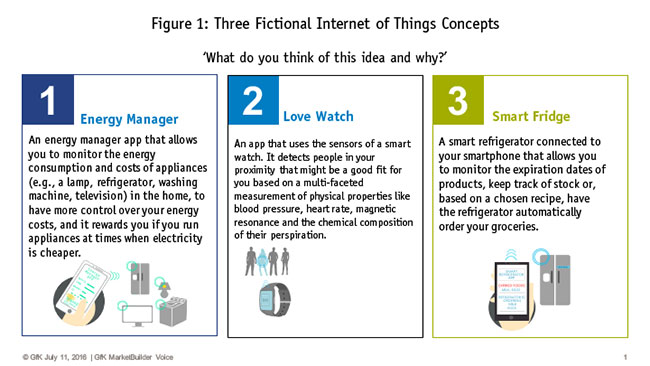
Using the technique described, we analyzed a dataset obtained from 300 U.K. consumers. Respondents were shown one of two sets of three new product concepts (Figure 1) in sequential monadic order. After a brief practice exercise wherein they tested the microphone and playback capabilities of their devices (laptop, desktop, smartphones, etc.), respondents were shown three home automation product concepts. Instead of multi-point Likert scales with which several attributes are traditionally rated, we asked one open-ended question.
The results showed that the Love Watch and Energy Monitor elicited high levels of arousal from “how” consumers responded to the concept; Again, this was inferred mathematically using acoustic signal analysis. This fact alone is not a sufficient basis for projecting purchase, however. As noted earlier, arousal can be coupled with positive or negative sentiment. In the case of the Love Watch, consumers with high arousal (based upon their voices) also tended to express negative sentiment and very low levels of activation. In contrast, an equal level of arousal was encountered among responses to the Energy Monitor but these occurred simultaneously with expressions of positive sentiment and activation.
In short, the results suggested the Love Watch would be an abject failure in-market while the Energy Monitor app could be quite successful and actually have the potential for emotional bonding with some consumers. In contrast to these two extremes, the Smart Fridge elicited middle-of-the-road levels of all three metrics, leading us to conclude it would not be a great market success if actually developed as written.
Prior to conducting the research described above, we tested eight product concepts which had passed traditional testing methodologies and were set to be launched in the following 12 months. Of these, one in particular represented a perfect illustration of the Type 1 error (false positive) situation that can occur in new product development. Specifically, one product of the eight products was developed based upon traditional Likert scale responses but was later deemed a failure. The method described in this article clearly identified that product as lacking arousal; consumer responses revealed a worrisome fact: the new product concept was not likely to create a sufficient level of emotional bond with consumers. Based upon this outcome, the voice-based system raised a red flag that should have precluded development of the product. Of course, this represents just one case study but it is indicative of the power of voice and its implicit measurement.
The power of the system described here goes beyond a more realistic, true picture of probable consumer behavior. Since each respondent’s reaction was recorded, it is available to researchers for listening. Further, since transcribed versions of the audio files are linked, one can perform dynamic keyword searches. As a result, the researcher can use an audio console that accompanies the quantitative data to gain deep insights into the “Why?” underlying the results.
Achieve a level of understanding
By performing online, dynamic comparisons such as gender, age or category users and listening to consumers’ responses, innovators achieve a level of understanding that was previously obscured by norms, adjustment factors and other methodlogical issues. Finally, we can offer clients a way to measure both implicit (System 1) and explicit (System 2), thinking as described by behavioral economist Daniel Kahneman.
The power of voice is at the center of this new approach to product and service concept evaluation. We leverage the spontaneity and expressiveness of the spoken word – so much more informative than typed answers or five-point Likert scales – and we use the transcribed text to provide context for the speech.
Companies that develop new products have now have a rich new alternative for making smart decisions about product development.