Editor's note: Ahmed Fouad is senior research manager at electrical and electronics manufacturing firm El-Araby Group.
Determining the sampling type is a vital stage in the research process. It indicates the representation of the population and influences the analysis techniques to be employed. For instance, part of multivariate analysis requires probability sampling to be executed to meet the requirements for the analysis. Applying probability sampling in market research is not always applicable mainly due to the unavailability of the direct sample frame – a traditional sample frame, where the entire population is sorted in a specific database with contact information. Imagine, for example, an attitude and usage study targeting users and non-users of a specific product. It would be quite hard (or impossible) to find a database of your target respondents. In such cases, you will not be able to employ one of the probability sampling types, limiting analysis techniques and affecting the representation of the population.
In similar incidents (where the traditional sample frame is not available), the indirect sample frame can be employed instead. Indirect sample frames rely on geographic areas to segment and draw the sample randomly from each sub-area or segment using published directories.
Usually, countries are divided into sub-areas (e.g., country > region > governorates > districts > blocks). The names of sub-areas may be different from country to country but this classification usually illustrates the structure of a country (how it is segmented, the total number geographic areas and other relevant information). This kind of directory can be a replacement of the direct sample frame because it contains all sub-areas that you are targeting in your research for geographical coverage and it frames the sampling units of your research (target respondents).
But it is a bit different than the direct sample frame as it does not allow for direct selection and access on the respondent level. Instead you reach the respondent gradually by selecting the sub-areas on different levels based on the classification and segmentation of the geographical coverage (e.g., city and country) until you reach the respondent. How is the probability sampling drawn? Here are the three steps.
Determine the geographical coverage. This stage involves determining the research coverage – that is, the geographical areas to be covered in the research scope. It could be the whole country or specific regions or cities. This determination is required to drive the second step to find the requirements to prepare the relevant indirect sample frame.
Prepare the indirect sample frame and population structure. In this step, we are looking for a frame that explains the geographical structure (i.e., how it is segmented, the number of areas/sub-areas and the name of each area/sub-area) of the research coverage. This type of information and frame could be available in a published directory from governmental bodies (e.g., statistical authorities). Try to find the most updated and relevant one and zoom into your research coverage to understand how many levels the structure contains and then prepare a list including the following fields:
- the names of the upper geographic areas (upper areas or segments under the geographical coverage of the research; for example, municipalities or regions that include sub-areas)
- the identification code of the upper geographic area (a unique number) such as 001
- size of the first (for example, population, number of sub-areas included in this level)
- the names of the lower geographic areas (sub-areas of the upper areas; for example, districts or cities)
- the identification code of the second level
- size of the second (for example population, number of sub-areas included in this level)
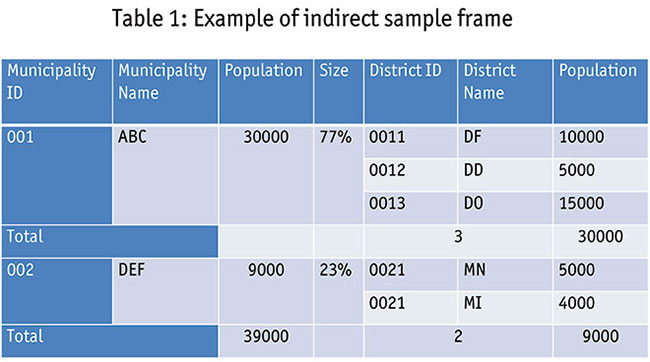
The number of levels depends on the geographical coverage of the research and how it is structured, so you may have two or more levels. See Table 1 for an example.

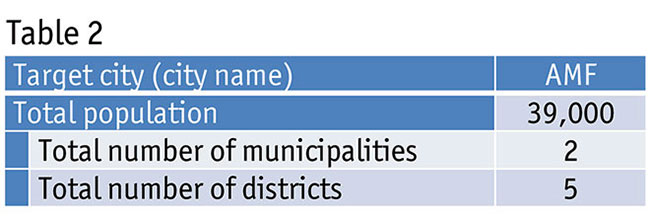
The list in Table 1 will be treated as the indirect sample frame; it contains all of the sub-areas that frame the target respondents of your population. Based on the indirect sample frame, you will be able to summarize the population structure as shown in Table 2.
Define the sampling technique and draw the sample. Here you will prepare the sampling design and procedures to be executed in the data collection stage. The area sampling will be applied (most probably multistage area sampling) where the sample defined across each geographic area of the population structure effectively represents the population.
The indirect sample frame in practice
In the following example, we will walk through a research project completed using the indirect sample frame to see how it can be executed.
The research was about testing a new concept with a B2B segment. The client provided the concept to be tested with the target respondents. Let’s look at the sampling plan and procedures.
Determine the geographical coverage. Cost constraints limited the research to a single city in the country, so one of the main business cities was selected to be the geographical coverage for the study.
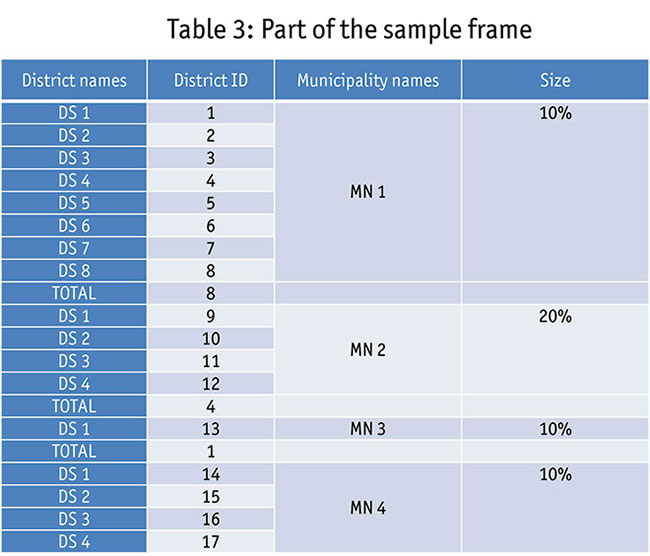
Prepare the indirect sample frame and population structure. We checked the published directory for the city to understand how it is structured and segmented geographically. It was determined that the city is divided into two main geographic units – municipalities – each of which is further divided into sub-areas called districts.
Accordingly, the indirect sample frame was prepared. Table 3 shows part of the sample frame.
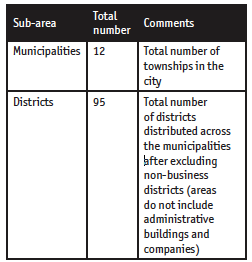
In summary, the population was structured as shown here.
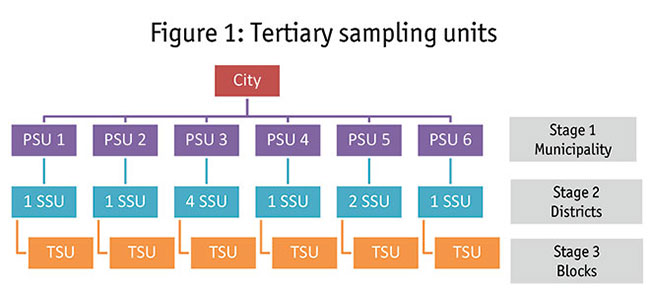
Define the sampling technique and draw the sample. The target audience was the managers working in the companies in different sectors within the city. The proposed sample was 100 interviews. Multi-stage area sampling was employed in three stages.
Stage 1: Primary sampling units
Using cluster sampling, six clusters were selected from the total municipalities in the city to represent the primary sampling units (PSU), the selection done on the basis of the availability of the number of companies and business buildings across the municipalities.
Stage 2: Secondary sampling units
In this stage, 10 districts were determined to be sampled. However, these 10 districts were distributed across the PSU using the probability proportional to size sampling. The size was the number of districts in each municipality. The district is treated as the secondary sampling unit (SSU).
Stage 3: Tertiary sampling units
Within the selected SSU, the companies were selected using the right-hand rule technique to select the street, building, floor and company (business buildings are commonly available in the targeted city) to be interviewed. This technique has been followed to ensure the randomization of the selection and remove the interviewer’s bias. Figure 1 illustrates the sampling design.
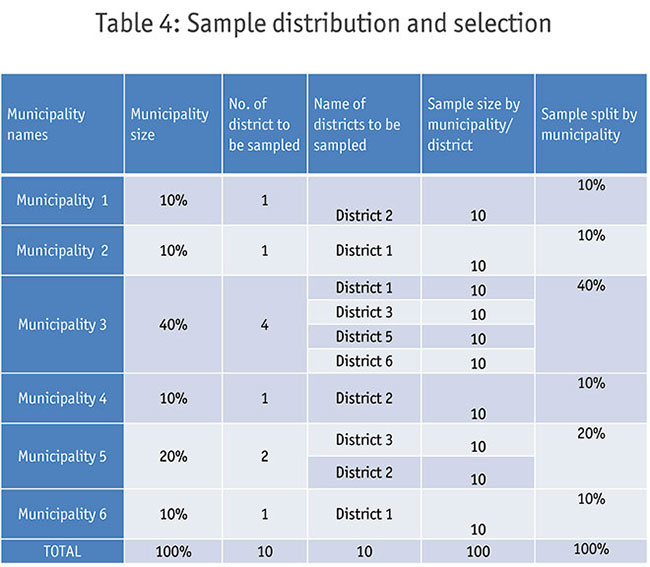
Sample distribution and selection
The proportionate distribution technique was applied to split the total sample size on two main elements: business sector of the company and sample size by municipality. To apply the selection procedures, the indirect sample frame (the selected PSUs) has been uploaded into the statistical software and then simple random selection is applied on the municipality level to identify which district to be sampled and finally the sample size by municipality. Table 4 shows the sample file.
Wider range of analysis techniques
While employing the indirect sample frame involves multiple processes to be developed and executed, the effort is quite justifiable compared to the expected benefits. We will be able to boost the sample representation as the indirect sample frame lets us draw the probability sample in absence of the direct sample frame. Moreover, we have an increased opportunity to apply a wider range of advanced analysis techniques because the probability sampling satisfies part of the advanced analysis technique requirements. As result, we maintain a high level of reliability for the research results and the recommendations based on them.