
A display of confidence
Editor's note: Roger Green is CEO/president of RG+A, a New Hope, Pa., research firm. He can be reached at rgreen@thinkrga.com.
 Pharmaceutical marketing researchers today need to shrink budgets while simultaneously increasing forecast precision. The logic behind this paradox is simple: Increased precision drives better marketing decisions that grow revenues. Shrinking budgets decrease costs. Growing revenues and decreasing costs both improve corporate profitability.
The simplest way to improve precision is to increase sample size but this increases cost. To improve precision without increasing sample, we need to observe more events without increasing the number of interviews we conduct. One method that creates more observable events per respondent is treatment simulation. In traditional marketing research, researchers base each estimate on one allocation per respondent. In simulation, researchers can ask a prescriber to treat multiple patients and then create a sample for analysis based on the total number of treatment events.
This article describes a validation exercise comparing the precision of allocation versus patient simulation methods. These results suggest that treatment simulation can improve precision while making more efficient use of sample:
- Adding treatment of four simulated patients to a forecasting study will reduce variance in 87 percent of studies compared to utilizing estimates or allocation methods. Adding treatment of eight patients will reduce variance 100 percent of the time.
- For the average study, adding treatment of four patients will reduce variance by an average of 30 percent. Adding eight patients will reduce variance by 50 percent. For products with wide differences in use between prescribers, variance reductions increase to 39 percent and 62 percent respectively.
- In brands for which prescribers estimate their likely use consistently, adding four patients will allow you to achieve your target confidence level with two-thirds as many interviews as simple allocation. For a brand with inconsistent use estimates, adding eight patients will allow you to achieve your target confidence level with 20 percent as many interviews.
More confident decisions
The ability of marketing researchers to provide precise forecasts is critical to decision makers. Tighter intervals produce more confident decisions in the form of product kills, in- or out-licensing or large investments. For example, a forecast that shows a 21 percent share estimate with a confidence interval from 20 percent to 22 percent will be far more valuable in supporting decision-making than a 20 percent share estimate with a confidence interval from 12 percent to 30 percent.
If we assume perfect measurement, the precision of share estimates is driven by two factors – the variability of the population and the size of the sample. Since the variability of the population is fixed, the only way to increase precision with a given research technique is to increase sample size. However, increasing precision by increasing sample comes with a steep price. To double your precision, you must quadruple your sample.
When estimating market share based on primary research, pharmaceutical marketing researchers typically ask each respondent to allocate the percentage of relevant patients to whom s/he will prescribe a given brand. The overall share estimate for that brand represents the average estimate across all physicians in the sample. Sample precision reflects the variability of physician share estimates and the sample size.
Patient simulation studies take a different route to estimating share. Each physician “treats” several simulated patient profiles using brands in the current market plus novel brands as depicted in target product profiles. Share represents the percentage of patients that received a prescription for the brand. Precision reflects the share and number of treatment events in the simulation. Since there are multiple treatment events per patient, it stands to reason that simulation will produce tighter confidence intervals than allocation.
Method
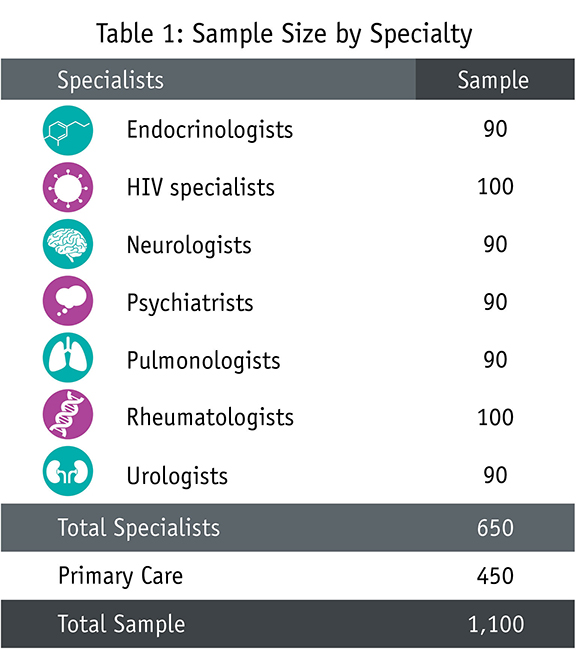
To test the relative precision of allocation versus patient simulation, RG+A conducted a survey with 1,100 physicians (Table 1) experienced with treating patients with one of seven diseases: Alzheimer’s, COPD, Type 2 diabetes, HIV, overactive bladder, rheumatoid arthritis and overactive bladder. Each respondent provided first- and second-line allocation measures based on patients they had treated over the previous 30 days. To enhance the accuracy of allocations, we provided physicians with lists of major brands and required them to review the allocated shares side by side before proceeding further in the study.
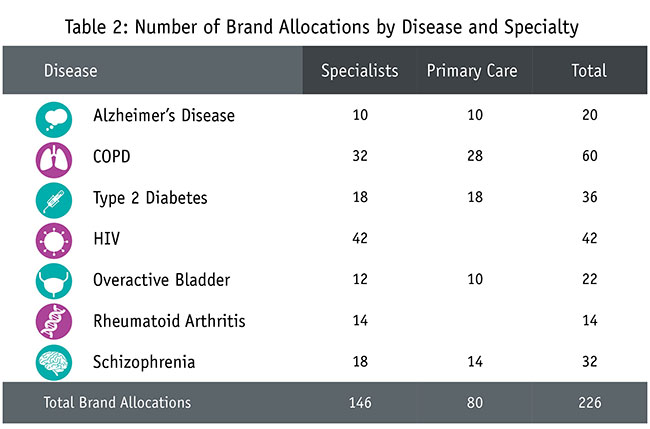
The actual number of brand allocations made by respondents varied by disease (Table 2). Across all seven diseases, the study provided first- and second-line allocations for 109 brands, yielding a total of 218 allocations. To ensure that each allocation was sufficiently robust, we eliminated eight first- and second-line brands because fewer than 30 physicians provided allocations, thus reducing the total brands for comparison to 202. We added 24 more share allocations based on estimated use of new products. This provided the final total of 226 allocation measures.
Each brand allocation was evaluated in four separate Monte Carlo models. In the allocation model, the model estimate reflects the distribution of allocation results. In the simulation model, we estimated that a physician’s actual prescribing would be proportionate to her allocation. For example, the model was built to assume that a respondent who allocated 25 percent for a given brand would prescribe that brand for 25 percent of patients. We then built three separate Monte Carlo models, one each assuming four, six and eight simulated treatments per respondent. In the simulation Monte Carlo models, we calculated brand share by counting the number of times the simulation showed the brand being used divided by the total number of patients treated. For all four Monte Carlo models, the process was repeated 1,000 times for each brand to observe the variation in estimated brand share (i.e., its precision).
Results
The first step in the analysis was to compare average simulated shares to allocated shares. Since the simulations reflected the allocated shares of physicians, one would expect the average simulated share to match each brand’s allocated share. This was indeed the result. Across 678 brand simulations (i.e., 226 brands simulated at four, six and eight patient treatments), all average simulated shares were within one-tenth of one percent of average allocated shares.
Impact on precision
The precision of simulated shares was calculated from the results of the 1,000 runs conducted on each brand. This measure (the standard deviation of the 1,000 share estimates) was compared with the corresponding standard error of the mean for the corresponding allocation to see which was smaller (i.e., more precise). The relative size of the measures of precision was also compared to assess the amount of improvement.
In this article, we describe a method as “more precise” if it reduces the statistical error around the forecast attribute. The “percent improvement” refers to the reduction of the standard error (a 50 percent improved might take it from 5 percent to 2.5 percent).
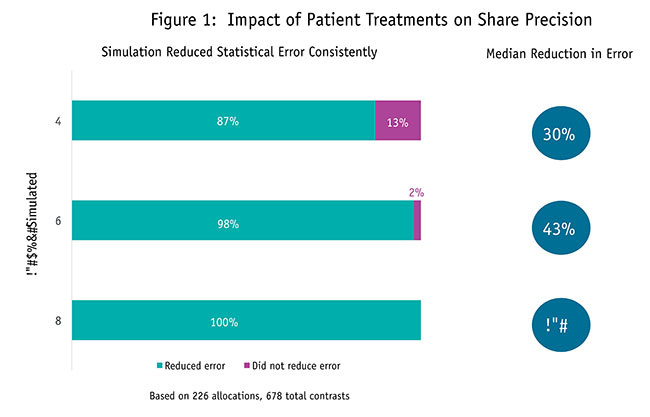
The results suggest that estimating brand share by having physicians treat patients enhances precision over allocation methods. Estimating share based on four patients provided more precise estimates for 87 percent of the 226 comparisons with an average improvement of 30 percent (Figure 1). Increasing the number of patients treated to six showed greater precision in 98 percent of the comparisons with an average improvement of 43 percent. Adding two more patients for a total of eight resulted in every comparison being more precise with an average improvement of 50 percent.
Similar patterns of results were observed among key subgroups. Having physicians treat patients to estimate share had a consistent advantage across disease and physician specialty, and whether the allocation was for first-line use, second-line use or potential use of a product concept. The pattern also held across allocated brand share with simulation enhancing precision among low-share brands as well as high-share brands.
Impact by amount of allocation variability
This result clearly supports the position that overall, treatment simulation will provide more precise estimates than allocation methods. The next question was how the level of variability in the allocation estimate affected the relative precision of allocation and simulation. Physicians usually allocate shares for brands with smaller market shares or very specialized populations within a tighter range than brands with larger share and more diffuse opinions about for whom and how often they should be prescribed. The strategic value of simulation will be greater if it reduces variance most in those places where variance is highest.
For this analysis, we divided allocation shares into three groups based on the magnitude of their 95 percent confidence intervals:
- high-precision estimates (confidence intervals less than +/- 2.5 percentage points; 16 percent of allocations);
- moderate-precision estimates (confidence intervals +/- 2.5 to 5 percentage points; 59 percent of allocations); and
- low-precision estimates (confidence intervals more than +/- 5 percentage points; 25 percent of allocations).
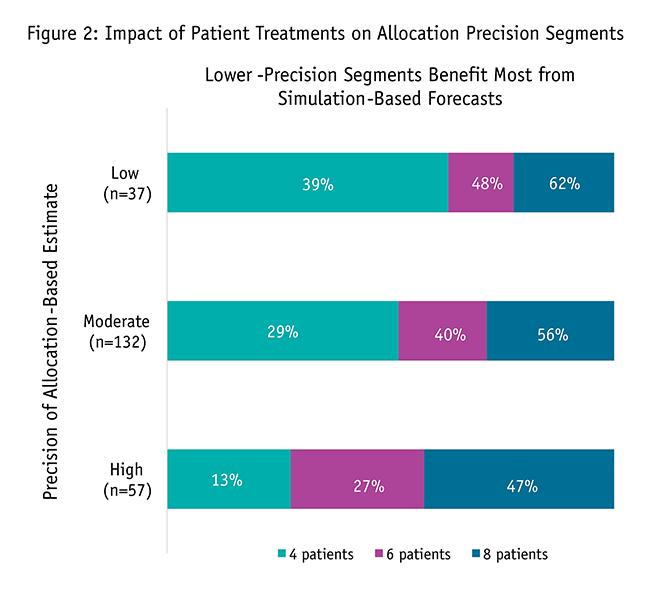
As the precision of allocation measures declined and confidence intervals grew larger, the amount of advantage from treating patients increased (Figure 2). The effect was most pronounced in shares based on four treatments, where the precision advantage grew 3.6 times, from 13 percent with high-precision allocations to 39 percent for low-precision allocations.
Sample bonus
The practical significance of enhancing precision by treating simulated patients can be demonstrated by converting the advantage into sample bonus. Sample bonus is the amount of additional allocation sample that would be required to match the precision generated by treating patients. As an example, 90 primary care physicians provided an allocated share for a new drug to treat Alzheimer’s disease. The estimate of share using four treated patients provided a 40 percent precision advantage. For the allocations to match this precision there needed to be an additional sample of 160 primary care physicians.
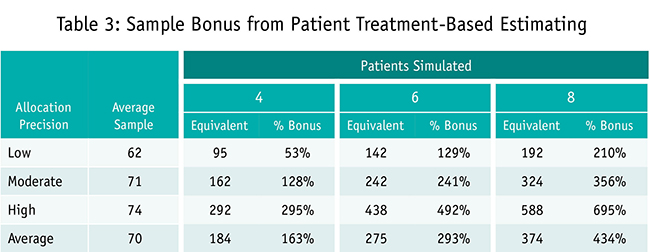
The sample bonus numbers comparable to the precision enhancements range from modest to eye-popping (Table 3). As one would expect, the bonuses were the smallest with high-precision brands ranging from 33 additional physicians with four patients treated to 80 with six treatment events and 130 with eight treatments. To put these numbers in perspective, the smallest bonus still represented a 50 percent increase in sample. In the less-precise segments where the bulk of the allocations exist, the bonuses ranged from 91 to 253 with moderate-precision brands and from 218 to 514 with low-precision brands. Given an average allocation sample in the 70 to 75 range, sample sizes would have to be two to four times higher to match treating patients for moderate-precision brands and four to almost eight times higher with low-precision brands.
More likely to be the right one
The precision of share estimates is an important consideration in marketing research. Share estimates directly impact many marketing decisions and lead to the investment (or non-investment) of millions of marketing dollars. When the cost of being wrong is more expensive than ever, more precise shares also mean the action chosen is more likely to be the right one. Confidence in forecasts is pivotal in allowing decision makers to choose a course of action and invest without hesitation or undue limits.
These results offer strong support that patient treatment simulation can provide more reliable information for decision-making by improving share precision dramatically. Treating as few as four patients improved precision by an average of 30 percent. Increasing the number of patients treated led to further precision improvements with six patients providing a 43 percent enhancement and eight patients providing a 50 percent enhancement.
The precision improvement offered by patient simulation can help marketing researchers squeeze more insight out of their already-tight budgets. Allocation methods require much larger samples – in most instances ranging from at least 100 to several hundred additional physician interviews – simply to provide the same level of precision as treatment-based estimates.
The number of brands, range of shares and class diversity of the brands studied suggest study results will be valid across most if not all drug classes and brands. The allocations came from seven different diseases and were provided by large, diverse samples of both specialists and primary care physicians. The 216 allocations studied represent first- and second-line brands as well as product concepts. The allocated shares studied ranged from the very small (less than 1 percent) to the very large (79 percent). It is highly unlikely that there are many, if indeed any, brand share precision examples that this research did not explore.
While it was not part of the current study, the results suggest measuring share by treating patients will provide benefits beyond forecasting. More precise share estimates increase the researcher’s ability to detect change. In statistical terms, it increases power. This means there is a better chance that studies comparing two alternatives will detect real and important differences. It also means that research monitoring change will be able to detect smaller differences, providing an earlier warning of marketplace changes.