
What’s the right mix?
Editor's note: Mike Grigsby is AVP, marketing analytics, at Caliber Home Loans, Coppell, Texas.
 Which touchpoint brings the most impact on loyalty? Which channel brings the most impact on customer satisfaction? Which vehicle brings the most impact on units? That is, where should marketing managers put their money? Should they invest in direct mail or price? Should they put more emphasis on call center or on website or on store experiences? Do these decisions vary by segment?
This article presents a business case using a client that asked just these questions. The analytic approach is to first do a segmentation and then merge together point-of-sale (POS) data with marketing research. Then, using simultaneous equations, insights are generated differently by segment. That is, one segment increases loyalty when investments are made in the call center but another segment increases loyalty through more marketing communications and another segment increases loyalty with better net price.
The simultaneous equation approach models how satisfaction feeds into loyalty and how loyalty impacts units that drive revenue. This puts an ROI on each portfolio tactic.
The client
This business case came from a client wanting investment strategy in its portfolio of channel and marcomm touchpoints. The client is a specialty fashion retailer headquartered in the Midwest with over $3.5 billion in annual revenue. It has 20,000 employees centered mostly in the northern U.S.
In terms of channels, it has a call center, an online presence and 1,400 brick-and-mortar stores. In terms of marcomm vehicles it used direct mail, e-mail and SMS. It has data both for sending and responding to marcomm. (Note: This project is about direct marketing and marketing touchpoints not about mass media or brand marketing.)
One key issue, as it often is in the retail space, was discounting. The client knew it discounted too much but did not have a way to optimize offers. The framework in this article attributed discounting to loyalty. Note that price sensitivity differs by segment, which is a key finding that yielded strategic implications.
Data
The current approach uses POS data merged to marketing research responses. This is not necessarily a requirement but if the goal is to get customers to rate experiences (store, web, call center) and rate marcomm, then some customer input is needed.
The marketing research needs to address factors of satisfaction and loyalty as well as channels – store and website and call center experience – as well as relevance and preference for marcomm, direct mail, e-mail and SMS. Most of these can be constructed using a Likert scale.
The POS data needs to be at least units and price (net of discounts). The key thing is to tie transactions to attitudes around channel experiences, satisfaction, etc.
Segmentation
The first strategic step is segmentation. The metrics to understand are loyalty, satisfaction and units. This model has loyalty as a factor of three survey questions: love of brand, likely to recommend and likely to revisit. Since this is the dimension of interest, these questions will not be segmenting variables. What should be used as segmenting variables will be those that cause the resulting loyalty; that is, satisfaction, store experiences, website experiences, call center experiences, price, number and type of marcomm.
The segmentation technique for this project is latent class. But for practical purposes any multivariate technique (k-means, support vector machine, etc.) should produce reasonable output.
Brief profile of the segments
A profile sketch (mean values by segment) of the segments is characterized in Table 1. Some of the distinguishing metrics are called out.
Segment 1 is the largest segment at 32% but only brings in 14% of the revenue. They are not loyal, have low satisfaction, bad call center experiences, good store experiences and are the next-to-most price sensitive.
Segment 2 is the most lucrative segment where 24% of the customers brings in 44% of total revenue. They are not price sensitive, are loyal, have high satisfaction and good store and call center experiences.
Segment 3 is mid-loyal but high satisfaction, good website and store experiences but average call center experiences. Marcomm is a good lever for this segment.
Segment 4 is next-to-least loyal and only brings in half of their fair share of revenue. They have bad touchpoints everywhere. Marcomm is not a lever for them.
Segment 5 is the most lucrative segment – best strategy is probably just continue doing the same! Three percent of the customers drive in twice their share of revenue. They use e-mail, are loyal, satisfied and least price sensitive.
Elasticity modeling
As mentioned, one key insight for the client is price sensitivity by segment. This was done through an elasticity-at- the-means OLS technique: Qty = f(price, marcomm, season, etc.).
One refinement could be elasticity by product by segment but for this project that was NOT done. That is, it’s possible for a segment overall to be sensitive to price but for a particular product the segment might NOT be sensitive to price. The client needs strategic levers to optimize discount offers by segment and maybe by product.
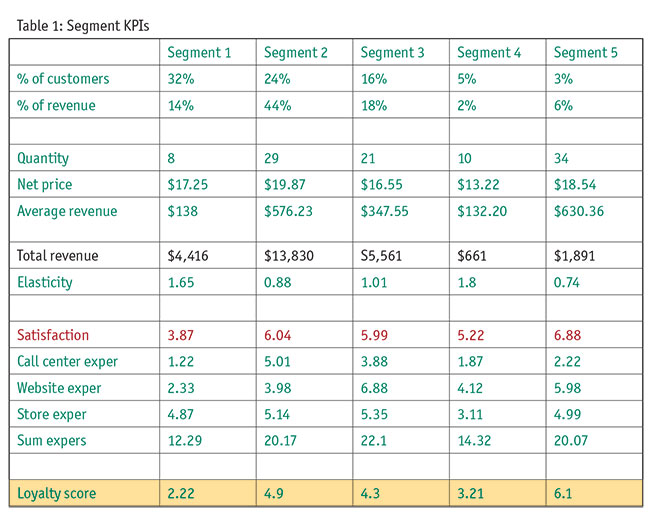
Note from Table 1 that Segment 1 is the most price sensitive (elasticity of 1.65) and Segment 5 is the least price sensitive (elasticity of 0.74). For more details on retail elasticity, see my article.1
Simultaneous equations
There are several hypothesized equations in the causality exploration. The goal is to increase quantity sold, of course, by increasing loyalty and increasing satisfaction, via increasing touchpoint experiences, marcomm (as a factor), pricing, etc.
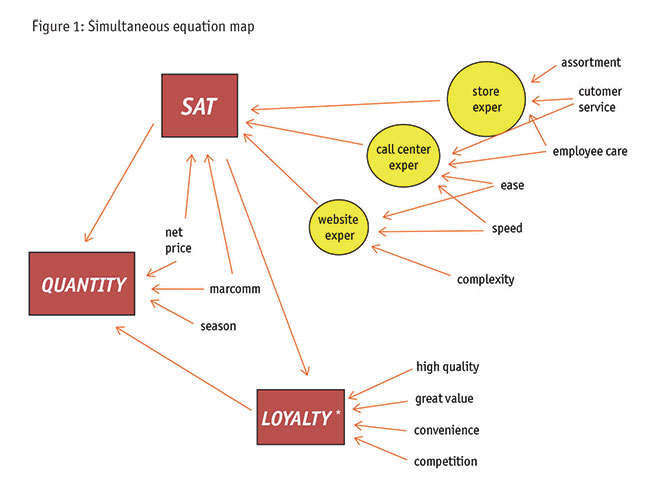
The solution to where to invest money comes in the simultaneous equation map. Below is the functional list of variables finally in each of the six equations (Figure 1 visualizes a variable map):
- Quantity = f(satisfaction, loyalty*, net price, season, marcomm)
- Satisfaction = f(net price, marcomm, store exper, call center exper, website exper)
- Store exper = f(cust service, employee care, assortment)
- Call center exper = f(cust svc, employee care, ease, speed)
- Website exper = f(ease, speed, simplicity)
- Loyalty* = f(satisfaction, high quality, great value, convenience, competition)
*Loyalty in this model is a factor, see below.
The model should find which levers provide the most impact to drive the metrics that increase units sold. That is, different segments have different sensitivities which require different actions. Or the same action can have a different impact on different segments.
(But first, a quick detour for clarification. The technique used in this model is 3SLS, an econometric approach to simultaneous equations. This is different from SEM, structural equation modeling. It is true that different disciplines have unique jargon that can mean different things to another discipline. When psychometric or political science or even marketing researchers say SEM, they mean the covariant analysis of linear systems. This is the extremely powerful technique wherein both latent and blatant variables can be hypothesized, measured, used and quantified. That is NOT the technique here. 3SLS is an econometric technique where all the variables are blatant, i.e., observed. The only similarity between 3SLS and SEM is that more than one equation can be modeled simultaneously.)2
The experiences questionnaire
This model specifically accounts for experiences in the store, on the website and from the call center. The survey questions address each of these areas, rolling up into factors called speed, ease and simplicity. Also included were dimensions of employee care, customer service and product assortment and style.
There can be a variety of questions to detail the touchpoint experiences. There should also be metrics around marcomm preferences (direct mail, e-mail and SMS). These should use relevance and overcommunication, etc.
Dimensions of high-quality, convenience, competition and great value are included. Dimensions of customer service, employee care, ease, speed and simplicity are also included.
The goal is to understand how different segments are differently sensitive to experiences. That is, one segment needs, say, better store or better website experiences (and the model may quantify these are mostly driven by customer service or employee care) than another segment in order to be loyal. Or one segment depends more on marcomm and net price for customer satisfaction. Again, that is the purpose of the model: to quantify different drivers, ultimately by segment.
The model results
The journey is one of touchpoints. As customers have different experiences they have different levels of satisfaction. And loyalty. And quantity demanded. Again, for one segment, store experiences might be key and for another segment the website needs to be effective and efficient, simple and easy.
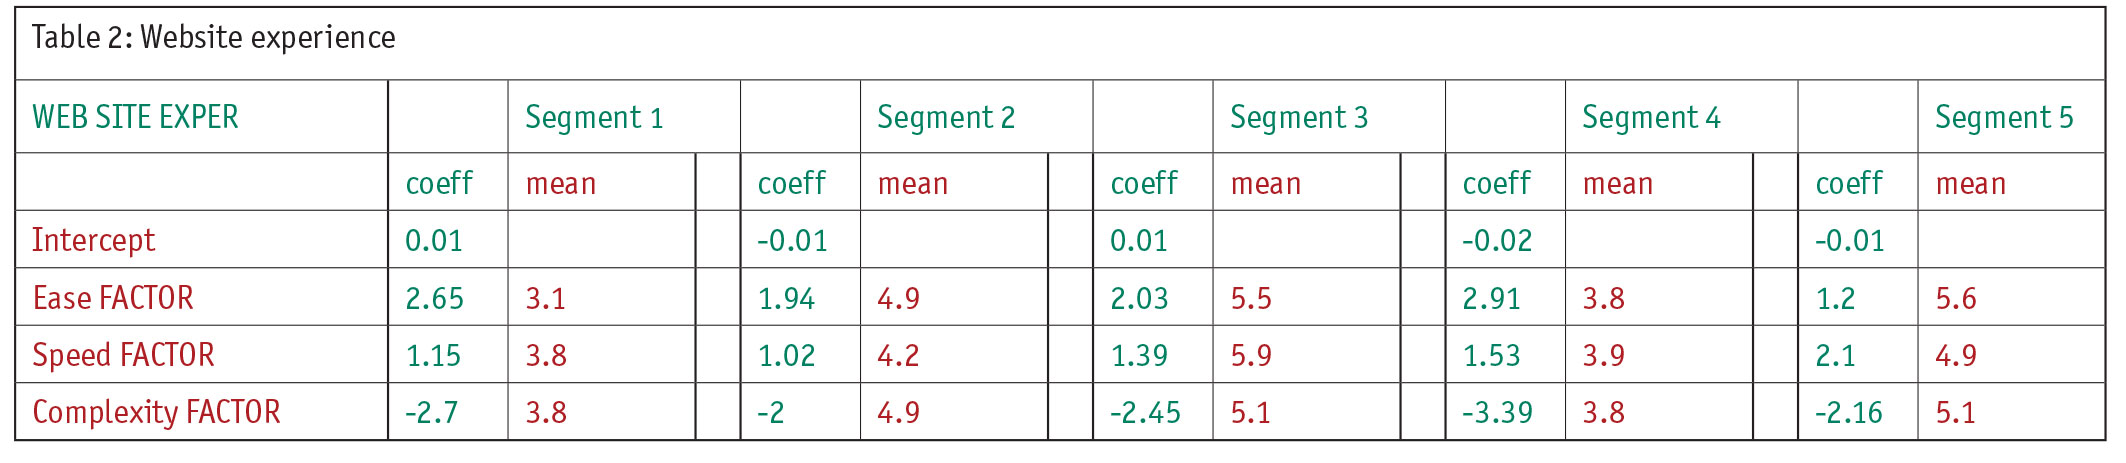
Table 2 shows simplified results of the website experience model, showing coefficients on the factors and means of the questions that made up the factors. Note that Segment 1 rates website experiences lowest overall at 2.33 (Table 1) and this score comes from the three factors: ease, speed and complexity. While Segment 1 rates speed lower than all other segments (at 3.8) the coefficient is next to lowest and thus is rather unimportant. This may indicate an investment in “speed” to improve website experiences for Segment 1 is not likely to be very impactful. However, “ease” is rated lowest as well at 3.1 but a very high coefficient of 2.65 might indicate an investment in “ease” will improve the website experience of Segment 1. So further investigation into what makes up “ease” and how to improve it could prove to be a smart strategy.
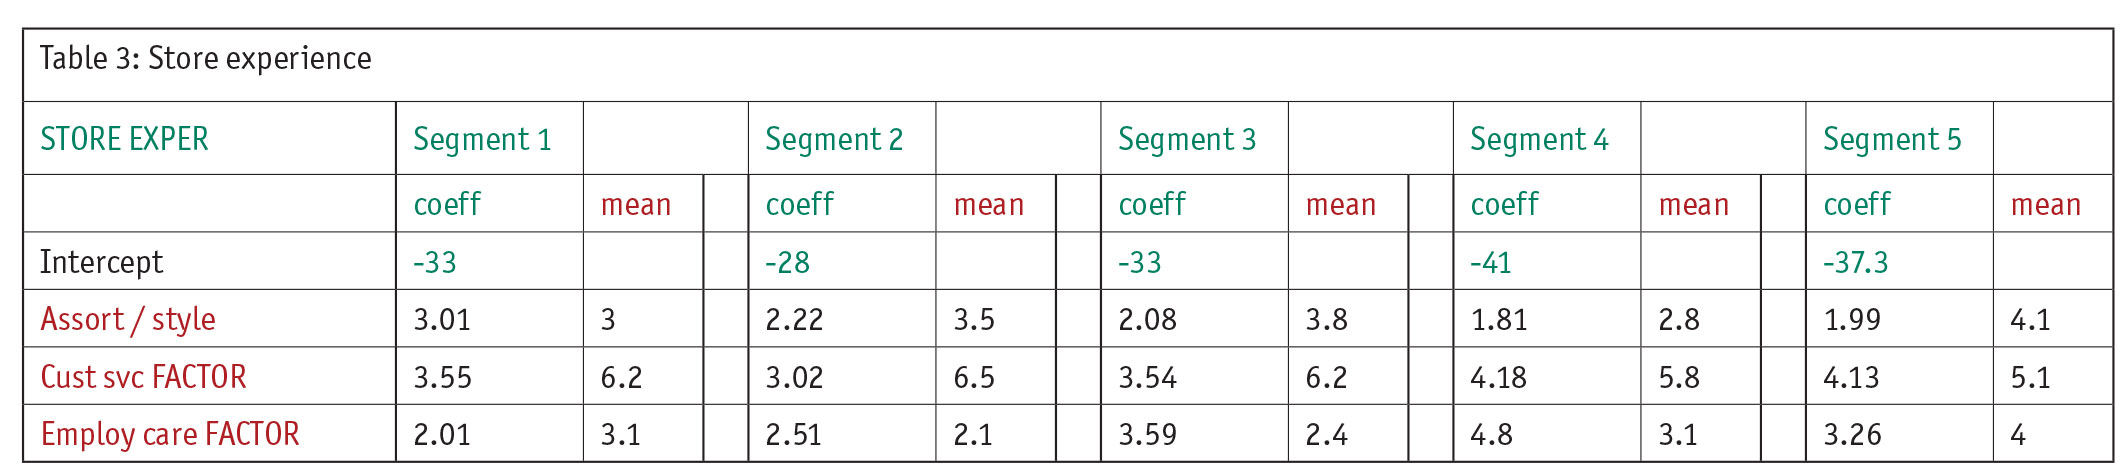
The store experience model is shown in Table 3. Looking at Segment 4 provides some important strategies – strategies that could not have been discovered unless a model like this was done. Segment 4 is one of the smaller segments but with the right strategies could increase quickly. They represent 5% of the customers but only bring in 2% of the revenue. In terms of store experiences, they rate it low (3.11 from Table 1).
How can this information be used to improve the store experiences which can improve satisfaction which can improve loyalty? Note the model indicates Segment 4 rates customer service next-to-lowest at 5.87 but the coefficient is 4.2 – the highest of all segments. This might lead the client to invest in improving customer service. This may require training employees in courtesy, conflict resolution or improved return policies, etc. This creates a business case in that if those metrics improve the impact on store experiences can be quantified which, as above, also drives satisfaction which also drives loyalty. Note a similar argument from employee care for Segment 4 is also done. While the mean is 3.1, which is average, again the coefficient is largest. The client can invest here with some confidence of improvement. Note that Segment 4 is NOT very loyal and a smart strategy is needed.
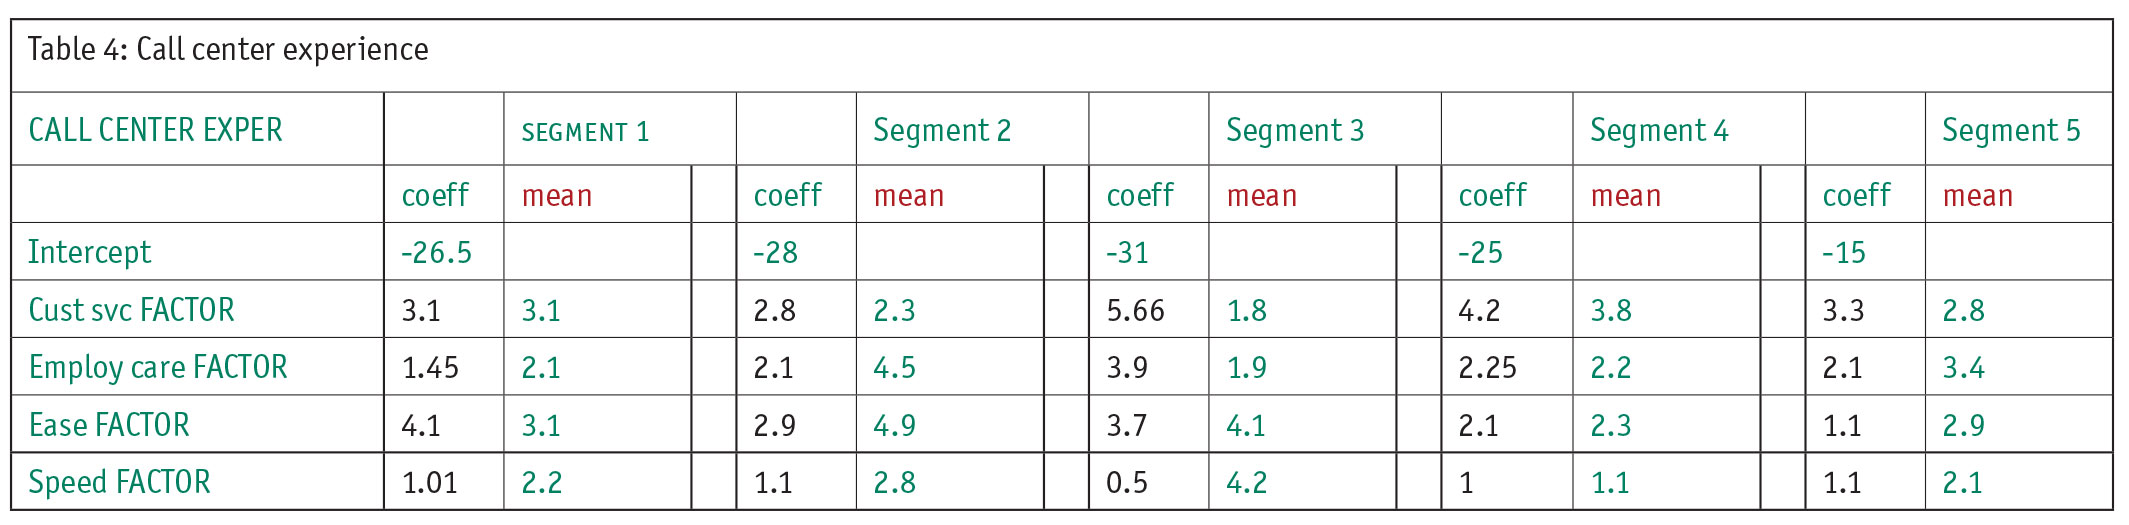
Now look at the call center model (Table 4) and focus on Segment 3. Recall from Table 1 that Segment 3 is 16% of the customers and brings in 18% of the revenue, clearly a segment to understand. Their loyalty and satisfaction scores are only average and they represent a large part of the client’s market so keeping them as customers is critical. Note that their call-center experiences are also average.
Explore what causes their call-center experience to be only average. They have the lowest “customer service” and “employee care” ratings but next to highest “ease” and highest “speed” factor. Look at their coefficients: highest “customer service” – apparently something critically important to them. And “employee care” is highest. The client needs to investigate improving “customer service” and “employee care.” Find ways to make this segment happier in terms of call center experiences. See below in the satisfaction and loyalty model; this will have a direct impact on increase these key metrics.
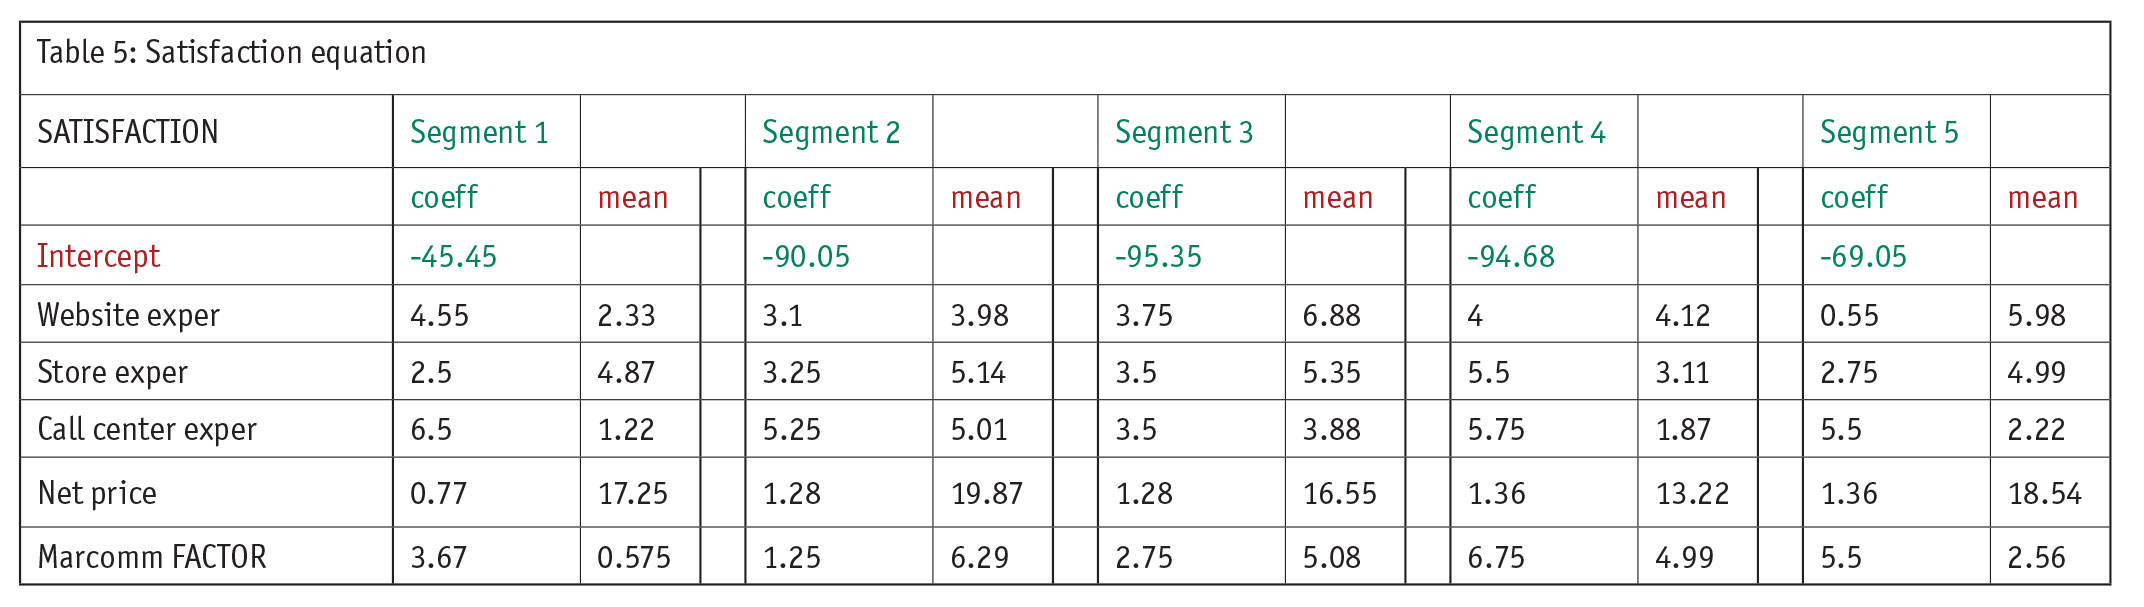
The satisfaction model (Table 5) is one of the key pieces of this analysis. Note that (from Figure 1) it is fed by the website, store and call-center experiences, marcomm and net price. (Seasonality is ignored in this simplified presentation.) Knowing how one of these touchpoints impacts satisfaction can give strategies for improving satisfaction and these results can be quantified. A business case can be made that if effort is spent on improving, say, call-center experiences, that improvement can be estimated and the resulting increase in satisfaction can be predicted and this drives loyalty and this drives units which drives revenue.
How can satisfaction of, for example, Segment 1, the largest segment, be improved? (For ROI, of course, the cost must be considered.) This segment is sensitive to price (see Table 1) but very little marcomm is sent to them, at 0.58, and communication is somewhat important to them with a coefficient of 3.67. One simple strategy would be to offer them, via marcomm, lower prices though discounting. So, the costs would be lowering net price and sending more marcomm and the benefit would be improved satisfaction. This same analysis can be (and should be) done by segment to see where the biggest bang for the buck can be gained.
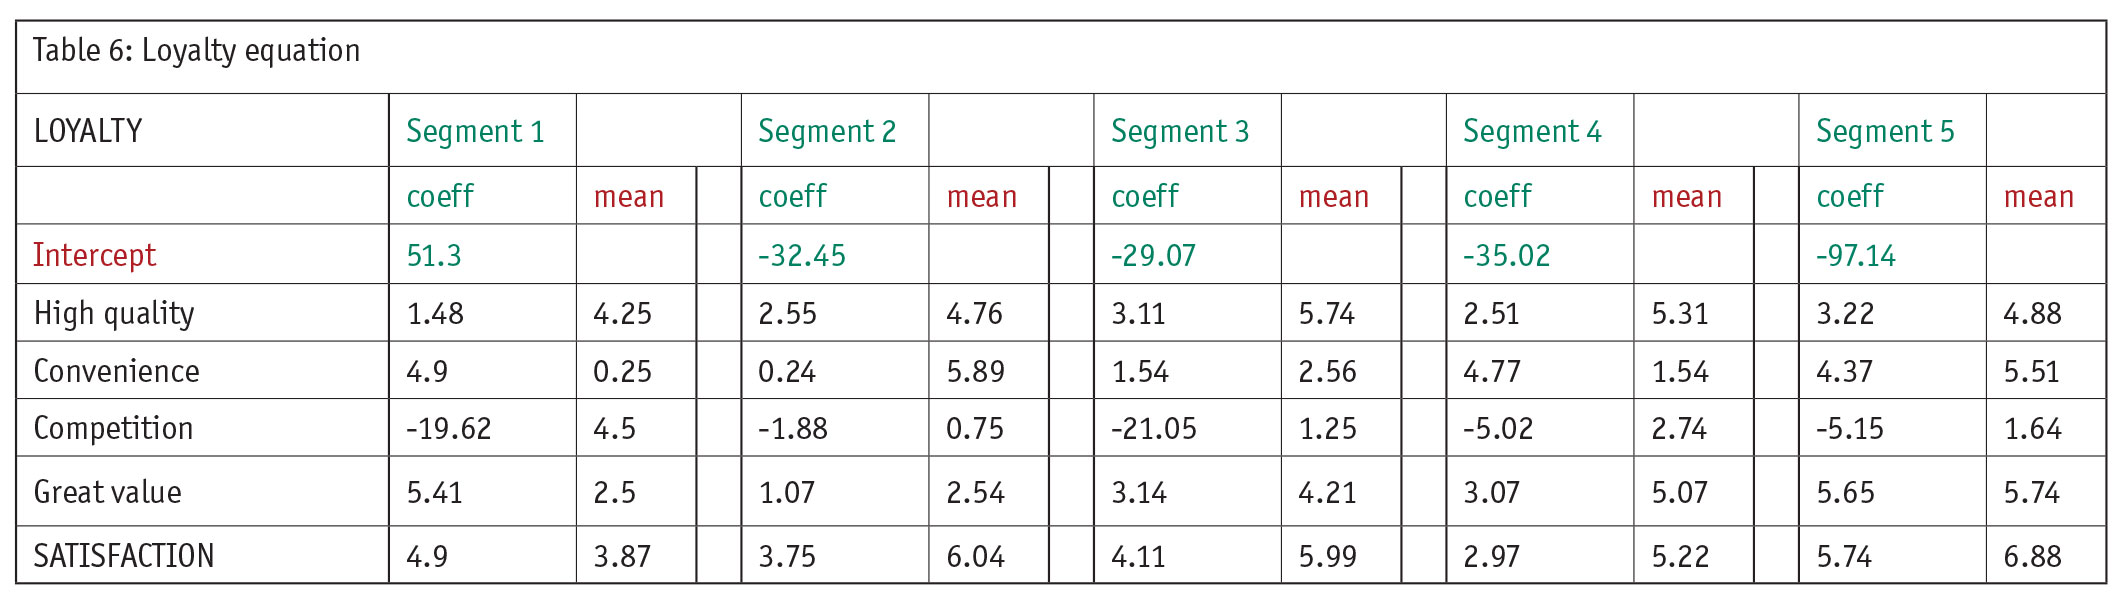
The loyalty equation is in Table 6. Note it is driven by four rational metrics perceived: high product quality, convenience to the store’s location, amount of competition near the customer and perceived value. These survey questions were meant to get at both the rational and emotional (satisfaction metrics from experiences) side of loyalty.
The demand equation in Table 7 is the final piece of the puzzle, ultimately what every client is focused on: how to drive sales. Of course, there are multiple routes to driving sales and that is the point of this analysis. As mentioned, the insights come when realizing that one segment’s route to increasing demand is different than another’s.
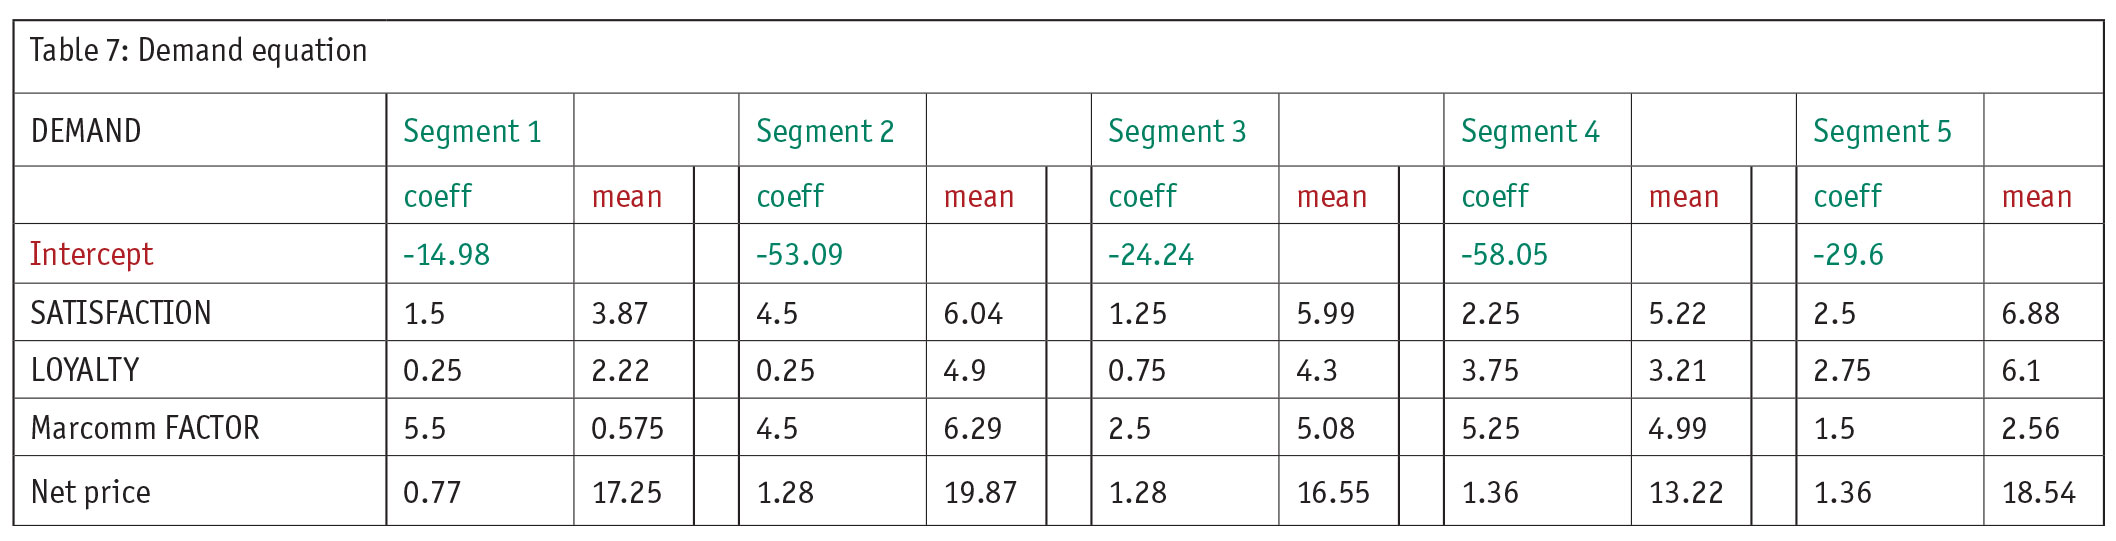
The model in Table 7 shows that satisfaction is a strong route for Segment 2 (with a 4.50 coefficient) but not so strong for Segment 3 (with a 1.25 coefficient). Using the satisfaction lever means investigating the touchpoint experiences (see the website, store and call-center equation above) as well as net price (elasticity) and marcomm.
Likewise, loyalty drives a lot of units for Segment 4 (3.75) but much less so for Segment 1 (0.25). Therefore, more investigation needs to be on quality, convenience, competition and value, as well as satisfaction.
The above two equations were not only independent variables in the demand model but also dependent variables in the own model. Thus, there is a staged impact that ultimately affects demand and that is the point.
Investigate and quantify
The value of this analysis is to investigate and quantify how different segments need different treatments to increase loyalty and satisfaction and sales. Tying marketing research into demand allows the interaction of operational and experiential touchpoints, as well as marketing levers like net price and marcom, to drive insights into a holistic strategy. Hopefully this case study will inspire further research and further industry use.
References
1 Grigsby, Mike. “Using elasticity to test retail pricing.” Quirk’s Marketing Research Review. December 2015.
2 Grigsby, Mike. "Advanced Customer Analytics." Chapter 18, “Identifying loyal customers.” Kogan Page, 2016.