
A new customer for customer insights
Editor's note: John Goodman is vice chairman of Customer Care Measurement and Consulting. He can be reached at jgoodman@customercaremc.com.
The quality function presents a large opportunity for enhanced research and impact for both customer insights and market research. Many readers may roll their eyes at that statement and either think, “Old news!” or “Not much there.” You will be wrong in a majority of organizations because the quality profession is undergoing a radical reinvention of itself. It is just now starting to recognize how customer experience has changed its mandate and data needs.
Traditionally, quality methods and metrics have applied solely to physical product quality. Measuring product quality was relatively simple because the answer, to a degree, was yes or no – either there was a defect or not. The zero defects concept, as described by James Halpin and popularized by Philip Crosby, was, in retrospect, a product of a simpler time.1 2
Enter the concepts of services (vs. physical products) and customer experience (CX). In 1984, Lynn Shostack introduced the service profit chain.3 Customer Care Measurement & Consulting’s (CCMC) predecessor, TARP, explored complaints and the impact of consumer problems on loyalty and word of mouth for the White House Office of Consumer Affairs.4 Also, Business Week highlighted TARP’s complaint and service research as key to the marketing success of GE, GM, Coors and American Express and the implementation of toll-free numbers to enhance customer access.5 In addition, Joe Pine introduced the concept of customer experience (CX) in The Experience Economy.6 Fred Reichheld suggested how to quantify the loyalty implications of a poor CX and customer dissatisfaction.7 The American Society for Quality (ASQ) established a Services Quality Division (SQD) in 1991.
Even with all the above attention and activity, most of the nearly 100,000 American quality professionals in ASQ still see the key objective and definition of the quality function as being zero defects, meaning zero physical defects. In a recent conversation, the 2022 chair of the ASQ SQD, Ryan Politis of Lowes Inc., noted that he still gets asked, “What is service quality and how do you measure it?”8 This is the big opportunity for customer insights! You can take the lead in helping the quality function define and measure CX.
Almost a blank check
In manufacturing companies, quality was table stakes and the basis of competition. In many technology companies like Cisco Systems and Apple, manufacturing quality was critical but, due to the complexity of the product, ease of use and quick-start guides were also important to success. Therefore, in many leading companies, quality received almost a blank check as well as responsibility for CX. At Cisco Systems, the EVP of quality was also responsible for CX. This trend has now defused through the rest of both manufacturing and services. For instance, at one of the largest satellite internet companies, the SVP of quality also has responsibility for CX. Therefore, if customer insights desires to be a key player in CX, it must engage with and support the quality function.
Quality needs help from customer insights in meeting four challenges: multiple uses; emotional and expectational outcomes; going beyond satisfactory to delight; and moving the business case from cost savings to one based on enhanced loyalty, word of mouth and delight. While quality is staffed by bright industrial, chemical and civil engineers, they are not equipped to deal with any of these four challenges.
1. Multiple product/service uses and outcomes
Unlike in the past, now there are multiple ways a product or service can be used, leading to multiple customer expectations of outcomes, depending on customer needs and the marketing message.
Quality can no longer simply be defined as adherence to physical specifications just adherence to a single physical spec – for example, adherence to a single width and length with a tolerance of plus or minus 1 millimeter. Quality performance must be defined by the market segment to which the customer belongs. For instance, rental car company Avis asks the customer which segment they are a member of, e.g., I like the premium cars with the latest technology, vs. I’m a business renter who wants four wheels to get out of the airport at a low cost, vs. I’m Aunt Tillie on vacation. Each of these segments has totally different needs and expectations.
2. Emotional and expectational dimensions
In addition to physical dimensions, there are communication, emotional and expectational dimensions to most products and services that often are more important than the physical product.
The role of the quality function must be broadened to include much more of the company operations. Quality must be involved not only in production and manufacturing but also in design, marketing and sales, delivery of the product and customer onboarding. When renting a car, some customers will appreciate being shown where the headlight and wiper switches are as well as being assisted with directions. Others may view this as an impediment to getting on the road. Measuring the delivery of the rental car with the correct level of communication and emotional connection is a completely foreign concept for the majority of quality engineers.
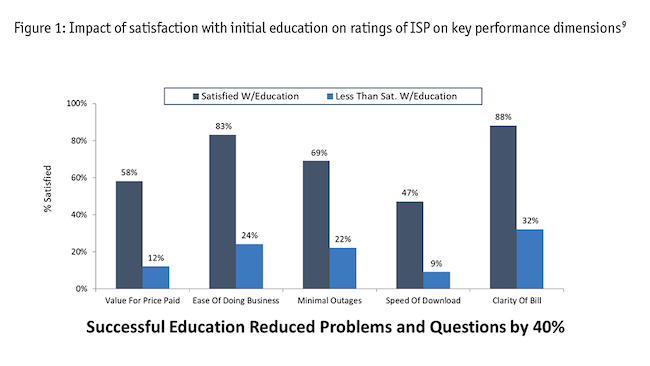 Such communication during product delivery can have dramatic impact on customer evaluations of the performance of technology. Figure 1 shows the results of a 2021 survey of over 2,000 customers on the impact of satisfaction with onboarding education vs. the percentage of customers satisfied with key operational attributes of internet service. Effective education reduces customer dissatisfaction by 40-50 percent across all key internet performance attributes. It is much cheaper to educate and onboard than to spend $200 million on extra infrastructure to enhance performance.
3. The top rating is no longer “meets spec” but can often be “delighted”
Research has now shown that CX can exceed a customer’s needs and expectations in a manner that creates delight. This implies that the experiential dimensions of the product or service can be as important to the customer as the physical product. Therefore, simply making the product lighter or larger or have a longer-lasting battery may or may not be important to the customer. On the other hand, a product that was more intuitive or was accompanied by an engaging “how to use” video might create delight.
The 2021 CCMC National Delight Study of 2,519 affluent consumers found that behaviors such as enthusiasm, transparency in marketing and empathy created delight and that consumers who were delighted were 8% more loyal than those who were just completely satisfied.10 Further, a third of consumers would pay more and many would spread positive word of mouth. Figure 2 summarizes the findings for the subsegment of consumers who were delighted with experiences in the financial services arena.
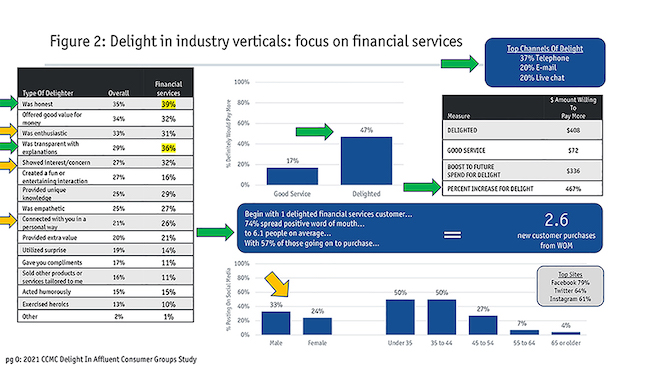 In the chart, honesty and transparency were the most prevalent delighters while enthusiasm, interest and empathy were simple, easily delivered delighters. As shown in the upper middle of the chart, customers who were delighted were 30 percent more willing to pay more for the same product or service (47% vs. 17%).
The middle of the chart shows the impact of word of mouth from customers who were delighted. When customers were delighted, 74% of them told other friends and acquaintances about the experience. An average of six people were told about their experience and of those, 57% were reported to have taken action on the referral. Multiplying these impacts together suggests that for each delighted customer, more than two new customers may have been won. While this may be optimistic, even if the number is cut by two-thirds, we can still surmise that each delighted customer will produce one new customer.
Finally, in the upper right-hand corner, we see that 37% of the delight was delivered by telephone while 40% by digital channels including e-mail or chat. The surprising fact here is that delight can be delivered digitally in addition to face-to-face and telephonic communication. With artificial intelligence being used to drive more customer response tools, there is a large opportunity to enhance CX via improved automated response. On the other hand, poor automated responses can do great damage.
The insights function must work with quality to improve evaluation of these transactions, measuring satisfaction, delight and willingness to recommend by type of issue and by channel used. The analysis of the outcome metrics (e.g., loyalty and willingness to refer) should address the types of behaviors that can create delight by going beyond the standard spec – especially in ways that add extra value to the product that the customer will pay extra for and spread enthusiastic positive word of mouth. This whole subject area is foreign to most quality professionals.
4. Business case based on loyalty and WOM impact
Quality traditionally created business cases based on reduced material waste and zero defects. The usual sources of data for quality are complaints and warranty claims. Often there is overlap between those two sources because the more serious complaints turn into claims where the company replaces or repairs the product at significant expense (think auto warranty claims). The basic flaw in the analysis done by quality is the assumption that the only damage done is the cost of responding to the reported problems.
Quality’s engineers need assistance in creating a business case for CX investment based on enhanced loyalty, revenue, margins and word of mouth produced by emotional interactions. Often the receipt of a few dozen or even 100 complaints is looked upon by quality and marketing as being a minor issue. What quality professionals and other executives often miss is the fact that only a small percentage of consumers take the time to complain about the problem.
CCMC’s research has shown that even in the auto industry, more than half of failures never turn into complaints or warranty claims and in the CPG industry, complaint rates to the company are often only 10% (https://bit.ly/3oISHi1). Therefore, for each problem reported, there are many more that are not but still result in damage to loyalty and word of mouth. A cost-reduction business case fails to include the non-articulated complaints and also overlooks the revenue damage. Further, there is usually no provision for the word-of-mouth impact of problems. These exclusions lead to a gross underestimate of the payoff of enhanced CX. The quality function will enthusiastically embrace this approach but will require assistance in its construction.
Further, complaint rates vary by the type of problem the consumer encountered. The critical question is, how many problems exist for each complaint received? This ratio of problems to complaints is called the multiplier. To estimate the real number of problems that exist in the marketplace for each complaint received, one must multiply the number of complaints by the multiplier. Then the revenue damage is estimated by multiplying the number of problems by the value of the customer.
Where does one derive the multiplier for any particular industry? Via a survey of a random sample of customers from that industry where you ask four questions:
1. Did you have any problems with the product or service?
2. What problems did you encounter? (Ideally aiding the customer with a granular list.)
3. Did you complain or seek assistance from the company?
4. If so, where did you go to seek assistance and what channel did you use?
Those four questions will allow you to quantify the multiplier for any particular channel of complaint. For example, if 10% of customers who had problems complained via the toll-free number, you know the multiplier for complaints received by phone is 10. The existence of the multiplier is a shock to many quality professionals who have assumed that almost all customers with problems complain. Quality professionals have simply been inwardly focused during their career.
The equation for calculating the revenue damage of a particular problem based on complaints is shown in Figure 3.
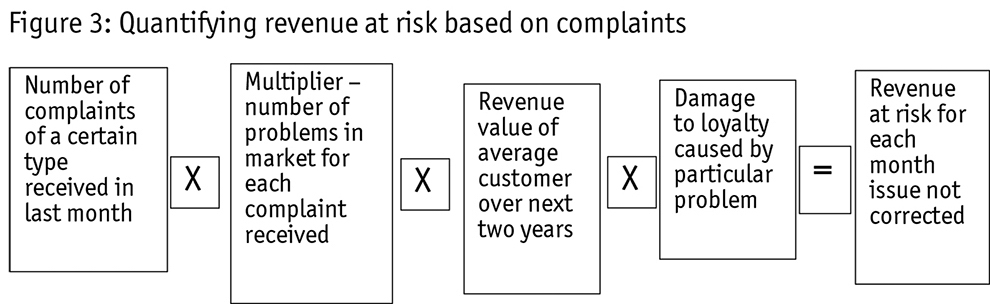
If the revenue damage estimate is based on a survey of a random sample of customers, there is no multiplier because the results of the survey are projectable on the marketplace. You simply multiply the percentage of customers encountering the problem times the damage to loyalty times the value of the customer to arrive at the revenue at risk due to a particular problem. Our firm recommends that at least one random sample survey of customers be conducted every two years to allow quantification of the overall multiplier for each company. This is a project that the insights function should drive but often the quality function will pay for. A more sophisticated study including word of mouth and sensitivity to price will allow inclusion of the CMO as a data user as the CMO is the officer most concerned about word of mouth and margins.
Creates a strong synergy
An alliance of quality and customer insights creates a strong synergy, leading to greater impact and improved customer satisfaction. In a benchmarking study of 200 companies, CCMC found that companies where quality and customer insights jointly collected and actioned the voice of the customer had twice the year-over-year improvement in customer satisfaction and a much higher rate of key CX issues being quickly addressed by top management.11
While the quality function will be most interested in how to create a more compelling business case for its projects, customer insights should start by educating quality analysts on the broader range of opportunities afforded by the end-to-end customer journey, the impacts and challenges of applying quality to sales, marketing and customer onboarding and the technical implications of applying the multiplier to complaints and warranty data. Draw their attention to the article in their own journal, Quality Progress, on applying quality to marketing and sales.12
Following are five steps to win quality as a new customer and source of both support and resources:
1. Work with the quality function to map the basic end-to-end customer journey. To this basic journey add the usually forgotten support functions of complaint solicitation, the full range of customer service channels as well as mechanisms for capturing the VOC across the entire journey.
2. Help quality identify key customer segments and expectations as well as physical performance aspects. Confirm the journey with a focus group or sample of customers from each segment.
3. Focus outcome and impact metrics especially on marketing and sales and education/onboarding. Identify which channels customers prefer and which lead to the most educated customer and the fewest unpleasant surprises. Work with digital marketing to try different incentives to motivate customers to be educated.
4. Expand quality performance metrics to include delighted and help quality plan and execute pilot tests where customer insights provides measurement assistance.
5. Assist quality in creating a revenue-based business case for enhanced CX where insights quantifies possible payoffs in terms of incremental loyalty and more impactful WOM referrals.
Create a win-win-win
The quality function has a seat at the C-suite table in many organizations that the customer insights function lacks. At the same time, the advent of CX has totally disrupted business as usual for quality while increasing both resources and expectations. Customer insights should move to help this engineering function address the social science and behavioral measurement issues to create a win-win-win for both functions and, most importantly, for the customer.
References
1 James F. Halpin, Zero Defects: A New Dimension in Quality Assurance, McGraw Hill, 1966.
2 Philip Crosby, Quality Is Free, McGraw Hill, 1979.
3 G. Lynn Shostack, “Designing services that deliver,” Harvard Business Review, January 1984.
4 Increasing Customer Satisfaction, Report Summary, U.S. Office of Consumer Affairs, 1986.
5 “Making Service a Potent Marketing Tool,” Business Week, June 11, 1984, p. 164-167.
6 B. Joseph Pine II and James Gilmore, The Experience Economy, Harvard Business School Press, 1999.
7 Fred Reichheld, The Loyalty Effect, Harvard Business School Press, 1996.
8 Conversation with SQD Chair Ryan Politis, director of productivity office of Lowe’s financial planning and analysis division, February, 2022.
9 Survey of internet service provider customers in 2021, CCMC proprietary study.
10 John Goodman, Othmar Mueller von Blumencron, “Making delight intentional,” Contact Center Pipeline, December 2021.
11 John Goodman and Thomas Hollman, “Factors leading to an impactful voice of the customer process,” Contact Center Pipeline, October 2019.
12 John Goodman and Ken Feldman, “Quality’s new frontier, applying continuous improvement tools to marketing and sales,” Quality Progress, June 2017.