
••• social networks
‘Community’ service in the digital age
Many companies missing out on offering customer support via Facebook
Despite the growing presence of social media for customer conversations, few organizations mine the social media channel to improve customer satisfaction. According to data from San Francisco research company MarketTools Inc., although 34 percent of the executives surveyed stated that they were aware of customers using social media to comment on or complain about their company and its products, less than one-fourth of these executives said that their companies “always” respond to these customers.
Twenty-three percent of companies provide customer service and support on Facebook, with 12 percent providing customer service and support via Twitter.
“Companies are increasingly embracing social media as a way to interact with their customers, though they are missing an opportunity to incorporate this feedback into a voice of the customer program,” says Karin Adams, director, enterprise products, at MarketTools. The study also revealed that 33 percent of executives said that their companies have a greater focus on using social media as a channel to capture customer feedback when compared to last year. When asked what areas of the company are active in social media, 44 percent of those surveyed cited public relations; 42 percent cited corporate marketing; and product marketing and customer service/support were each cited by 34 percent of the respondents.
Of the 68 percent of companies that have an active presence in social media, 48 percent have an active presence on Facebook; 24 percent on Twitter; and 17 percent on their own company blog. Twenty-two percent stated that their company’s CEO regularly participates in social media on behalf of the company. Facebook is the social media channel of choice, used by 68 percent of the CEOs, followed by 44 percent who participate on the company blog and 35 percent who participate on Twitter.
www.markettools.com
••• retailing
Fashion faves
Women like buying what Kohl’s is selling
Kohl’s is the nation’s favorite fashion retail chain, according Market Force’s annual consumer study. 2011 was the third year in a row that Kohl’s earned the top spot. Nordstrom ranked as consumers’ second favorite, followed by Macy’s, Dillard’s and JCPenney. 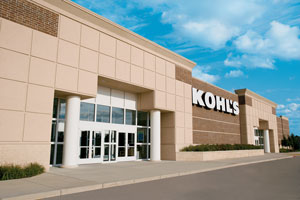 Market Force, a Boulder, Colo., research firm, surveyed almost 7,000 consumers across North America and asked them to select their favorite fashion retailer from a list of 91 national chains. Results were first tallied based on the number of total votes, where Kohl’s took a clear lead with 16 percent of the vote total. Market Force then indexed the findings by store count. The results showed that Kohl’s was still consumers’ top choice.
Before the votes were indexed, Kohl’s earned the most total votes, while JCPenney amassed the second most, followed by Macy’s, Walmart and T.J.Maxx. Once indexed, brands like Walmart, Target and Dress Barn still made it into the top 16 but landed toward the bottom of the rankings.
“Kohl’s has achieved that great balance of broad selection and good prices, particularly in the casual clothing sector. But notice that Nordstrom secured second place and specialty stores like Coldwater Creek and Ann Taylor Loft came in sixth and seventh,” says Janet Eden-Harris, chief marketing office for Market Force. “Those results might suggest that consumers are loosening their pocketbooks in favor of quality over a bargain for select fashion items.”
Market Force also looked at how the favorite fashion retail chains compared in different categories to determine if certain attributes set apart the leaders from the rest. Kohl’s performed consistently well across the board, leading in almost every category, including no-hassle returns, prices, easy parking, dressing rooms, atmosphere and customer service. Marshalls was the only retailer that received high marks for loyalty program benefits. Macy’s trumped the others for offering the widest assortment of clothing and accessories from specific designers.
However, while consumers have their favorites they’re also willing to branch out and try new fashion retailers. In 2011, consumers tried new brands at a higher rate and bought more when they did. Thirty-two percent of consumers surveyed in October 2011 reported trying a new fashion retailer over the past 90 days, up from 14 percent in 2010.
2011’s No. 1 fashion retailer Kohl’s received the most new trials by consumers, followed by Abercrombie & Fitch and H&M. But new trial is heavily influenced by the proximity of stores to consumers; so larger brands will tend to dominate. When indexed, H&M convinced the largest number of consumers to visit one of their stores for the first time, followed by Nordstrom, Anthropologie, White House|Black Market and Coldwater Creek. Of those surveyed who tried a fashion retailer for the first time, 75 percent said they made a purchase during that visit, up from 59 percent in 2010.
A friend’s stamp of approval wields significant influence in the decision to walk into a new retailer. The survey found that recommendations from friends are the top impetus for consumers to try a new store, followed by “just an impulse to go shopping.” Really great sales, promotions and discounts and the inability to resist an item they love were other factors that weighed heavily in consumers’ new store trials. The reasons given for not making purchases at a new retailer were high prices or the inability to find sale items.
The study also showed that consumers use online research extensively before shopping but manage online relationships with retailers carefully. For example, the majority (73 percent) said they research prices online before they head to the store and one-third turn to social media for information about fashion retailers or clothing brands. However, few follow retailers on Twitter (7 percent, up from 2 percent in 2010) or friend them on Facebook (38 percent). Social media advertising plays a very small role in influencing consumers to try new retailers. So, while consumers acknowledge that social media is highly influential in their shopping choices, it appears that conversations with friends are much more impactful than the social content pushed by the retailer.
However, social media does appear to be playing a larger role in their online research. In Market Force’s 2010 retail survey, one in 10 respondents said they had read an online post or blog about a specific retailer or brand of clothing. That number jumped to 37 percent in 2011. Additionally, 7 percent of consumers in this year’s survey had blogged or created an online post about a specific retailer or brand of clothing.
Not surprisingly, consumers continue to be conscious of spending this year. Most consumers (74 percent) reported spending an average of less than $100 per month on clothing, while one-quarter said they spend up to $250 every month, similar percentages were found in the study a year ago.
www.marketforce.com
••• mothers
Small group, big influence
The social impact Mom Bloggers
Mom Bloggers, defined as women who have at least one child in their household and have read or contributed to a blog in the past 30 days, make up 14 percent of all American moms (defined as women with at least one child in the household). However, according to  Scarborough Research, New York, Mom Bloggers’ social and political influence reaches far beyond the confines of the playground. Mom Bloggers are much more politically involved and socially mindful than their non-blogging counterparts.
Over three-quarters of Mom Bloggers assert that they always vote in presidential elections, while 45 percent always vote in state elections. In terms of party identification, 29 percent of Mom Bloggers self-identify as Democrat, 25 percent as Republican and 29 percent as Independent. Seventeen percent choose none of these labels to describe themselves. Mom Bloggers are more than twice as likely as all mothers to have contributed to a political organization in the past 12 months.
While no single political party unifies Mom Bloggers, they find consensus via cultural and environmental issues. They are more than twice as likely as all moms to have contributed to an arts/cultural organization. Additionally, Mom Bloggers are 75 percent more likely to have contributed to a social care/welfare organization and 64 percent more likely to have contributed to an environmental organization. In fact, Mom Bloggers are 85 percent more likely than all mothers to support a politician based on environmental issues and they are 38 percent more likely to have done volunteer work in the past year.
Taking a demographic look, Mom Bloggers are 52 percent more likely than all mothers to have completed a college or post-graduate education. Though they are roughly the same average age (37) as moms overall, the average household income for Mom Bloggers is $14,000 higher, totaling $84,000 per year. They are 88 percent more likely to pay more for eco-friendly products and services and 89 percent of Mom Bloggers have children between the ages of two and 11.
Buying behavior for Mom Bloggers is consistently motivated by environmental concerns and awareness. Mom Bloggers are 69 percent more likely than all moms to buy organic food on a regular basis. They are also 46 percent more likely to purchase locally-grown food. Additionally, Mom Bloggers are 49 percent more likely than all mothers to buy eco-friendly cleaning products.
In terms of media consumption, Mom Bloggers were 38 percent more likely to have visited a broadcast TV Web site in the past 30 days and 51 percent more likely to have visited a newspaper Web site in that time. Mom Bloggers are 20 percent more likely to listen to news radio and 58 percent of Mom Bloggers watch the local news on television. Mom Bloggers’ online habits are also illustrative. In the past 30 days, nearly all (90 percent) Mom Bloggers have visited a social networking site; 77 percent checked the weather; more 70 percent paid bills online; and nearly half browsed the Web for coupons.
www.scarboroughresearch.com
••• social networks
More harm than good
Despite social networks’ ubiquity, adults think they’re bad for kids
 Social media use is becoming more prolific among all age groups but not all Americans agree it’s appropriate for all ages. While social networking sites offer the promise of connectivity, friendship and information constantly streaming in, the majority of American adults (53 percent) believe that social media is harmful to the development of today’s youth, according to a national telephone survey of registered voters by Poll Position, an Atlanta research company. Twenty percent said it is helpful in the social development of youth, 17 percent said it is not making a difference either way and 11 percent did not offer an opinion.
Among men, 22 percent said it is helpful, 17 percent said it is not making a difference and 9 percent had no opinion. Among women, 18 percent found social media helpful in the social development of young people, 17 percent said it is not making a difference and 13 percent did not have an opinion.
Republican respondents rated social media the most harmful at 65 percent, compared to 40 percent of Democrats and 54 percent of Independents.
www.pollposition.com
••• brand research
Top trusted brands of 2011
Retailers and investment firms shine; Internet and TV service providers suffer
USAA, Amazon.com, Costco, Edward Jones, Hyatt, Sam’s Club, TriCare, Kohl’s, Walgreens and Lowe’s earned the top 10 spots in the 2011 Temkin Trust Ratings, a report from Waban, Mass., research company Temkin Group that examines the level of trust that consumers have in 143 large U.S. companies. The research is based on a survey of 6,000 U.S. consumers, who rated their recent customer service interactions with companies across 12 industries. Only eight companies earned “very strong” ratings while 26 earned “very weak” ratings. The study uses the Temkin Trust Ratings to gauge consumer feedback for airlines, banks, credit card issuers, health plans, hotels, insurance companies, insurance carriers, investment firms, Internet service providers, retailers, TV service providers and wireless carriers. Three companies showed up twice in the bottom of the ratings: Comcast, Charter Communications and HSBC. The other companies in the bottom 10 of the 2011 Temkin Trust Ratings are CIGNA, Time Warner, U.S. Bank and Anthem.
In the overall results for the 12 industries, retailers and investment firms received the top scores, with an average rating of “strong.” The bottom two industries, Internet service providers and TV service providers, earned an average rating of “very weak.”
www.temkingroup.com
••• auto research
Does Gen X/Y care about cars?
Auto industry faces future of lukewarm loyalty
During the past decade, automobile manufacturers have experienced a steady decline in customer loyalty for specific brands. The faltering economy, bankruptcies and product safety issues have taken a toll on automotive brand loyalty, as 48 percent of respondents in 2011 plan to buy the same brand of car as they currently own, down 7 percent over the past decade, according to the GfK Automotive Intentions and Purchases Study from New  York research company GfK Custom Research North America.
But recession and recalls aren’t the only things at play. In fact, these may not be the reason consumers do not replace one brand with the same brand. Generation X (born 1965–1980) and Generation Y (1981–1994) have yet to demonstrate anywhere near the loyalty of their older counterparts. Gen X and Gen Y have the lowest loyalty factor of all age groups. Consequently, Gen X and Gen Y’s ever-increasing presence in the automotive marketplace will continue to pull overall brand loyalty downward, assuming current allegiance levels remain the same.
Gen X and Gen Y are more concerned with their home entertainment systems, smartphones and the Internet than the car they drive. Automobile marketers must develop a method to reach these consumers and offer them automobiles that may incorporate some of the connectivity technology they consider most important to them.
“Automotive brands need to be aware of the effect of disenfranchisement among both Generation X and Generation Y and ensure appropriate product and marketing efforts,” says Doug Scott, senior vice president of GfK Automotive. “Younger purchasers, Generations X and Y, are least brand loyal, while Boomers and Pre-Boomers remain brand loyal.”
www.gfk.com