African-Americans active, interested investors
The Hunter-Miller Group, a Chicago research firm, has released a report on the investment habits of African-Americans compiled from a number of primary and secondary research sources. Many are pursuing saving and investment strategies to support their household needs and wants, retirement and the unexpected. However, the saving and investment habits of blacks tend to differ from those of whites, particularly at lower income levels, due to financial differences as well as a lack of knowledge and confidence regarding options. With the increasing affluence of African-Americans and an interest in fiscal planning, a tremendous opportunity exists for financial organizations to approach this underserved market in culturally appropriate manners to build wealth within the community.
The growing affluence of African-Americans is evident in:
- Their $723.1 billion in spending power in 2004, a 127.2 percent increase from 1990. It is expected to increase 33.4 percent to $964.6 billion by 2009, according to the Selig Center for Economic Growth.
- Their estimated wealth transfer value of $1.1-$3.4 trillion between 2001 and 2055, which will primarily be passed on to younger generations, according to the Center on Wealth and Philanthropy. Aggregate black household net worth was $1.1 trillion in 2001.
- The fact that 33 percent of black families had income of $50,000+ and 16 percent had income of $75,000+ in 2002.
- Their median income increasing 88 percent between 1987 and 2001, outpacing the 62.1 percent growth for whites.
However, their saving and investment activities tend to be unique given overall financial differences compared to whites and less knowledge of and/or confidence in the many options:
- Home ownership, a step in asset building, has been on the rise from 47.7 percent in 2002 to 49.1 percent in the 4th quarter of 2004. And 61 percent view real estate as the best investment overall compared to 51 percent of whites.
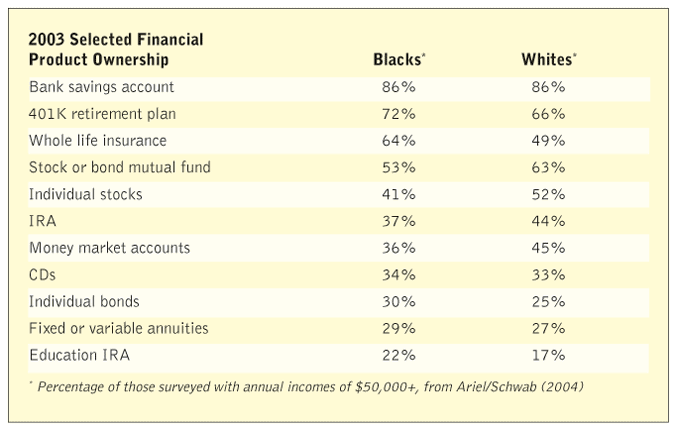
- 68 percent had money invested in the stock market in 2004, up from 61 percent in 2003 but still down from 74 percent in 2002, compared to 80 percent of whites, per Ariel/Schwab.
- They are becoming more confident and knowledgeable about the stock market. Forty-one percent of non-investors intended to invest in the stock market compared to 28 percent of white non-investors, per Ariel/Schwab.
- Although the net worth of blacks is increasing, they have less money in long-term investments compared to whites with similar incomes, primarily due to lack of knowledge.
- 59 percent of black workers or their spouses have saved for retirement compared to 71 percent of all workers, according to the 2003 Minority Retirement Confidence Survey (RCS). Their average IRA balance was $20,688 in 2002 compared to $27,873 for whites and their average 401(K)-type plan balance was $20,338 compared to $35,808 for whites, per EBRI. For those with annual incomes of $100,000+, 66 percent of blacks compared to 78 percent of whites had retirement account savings of $50,000+, per Ariel/Schwab.
Their attitudes and beliefs about saving and investments practices often differ from others as well: - One in four blacks has a professional financial adviser as they realize planning has become more important and they tend to trust someone from a well-known company who is recommended by friends or family and is involved in community development, according to a recent LIMRA survey. Fifty-eight percent of black savers prefer suggestions from a professional regarding saving and investing but often make their own decisions; they are twice as likely as all workers to want a paid professional to manage their investments, per the 2003 Minority RCS. With establishment of a trusting relationship, often with someone they can relate to (of color), blacks are more likely to be loyal to financial advisers.
- 58 percent compared to 44 percent of whites feel that you can never have too much money and 72 percent of blacks versus 63 percent of whites feel money is very important, according to an Ariel/Schwab study.
- 83 percent of blacks and 80 percent of whites believe that saving for the future should be a priority; 84 percent versus 77 percent respectively learned from their parents to save a portion of all earnings, per Ariel/Schwab.
- 44 percent of blacks compared to 58 percent of whites consider retirement a savings and investment goal while 20 percent and 14 percent respectively consider sending kids to college a goal, per Ariel/Schwab.
- 42 percent versus 33 percent of all workers are not too confident or not at all confident about having enough money to live comfortably through retirement, per the 2003 Minority RCS.

The African-American market is becoming increasingly affluent and requires greater education and outreach with respect to financial planning for the present and the future. However, this market has traditionally been underserved by financial institutions. Thus, a tremendous opportunity exists for culturally sensitive organizations to approach African-Americans with financial advice as well as saving and investment options to meet their needs. Many financial institutions have already recognized the long-term significance of establishing a presence in black communities as well as forging partnerships with black organizations and churches to advance the economic base of the community and its members. In addition, some have engaged in conscious efforts to recruit and train professionals of color to cater to the black community. Outreach and support of the African-American market must become a higher priority for the financial services industry given the significant and increasing buying power of this group, its estimated wealth transfer value, and the interest in becoming financially savvy. For more information visit www.huntermillergroup.com.
Hispanic-Americans are untapped market for radio ads
The rapidly growing U.S. Hispanic-American population represents untapped potential for the radio advertiser market, according to a new study by Arbitron Inc., New York. Arbitron’s Power of Hispanic Consumers Study 2004-2005 shows that Hispanic consumers are heavier users of radio than newspapers or television. They spend significantly more time with radio than non-Hispanics, averaging 22 hours and 30 minutes per week. Hispanic-Americans spend half their radio time listening to Spanish-language formats, a group of formats consisting of diverse musical and programming tastes, from tropical to talk.
“According to the U.S. Census Bureau, there are approximately 40 million Hispanics-Americans living in the U.S with $686 billion in spending power, a number that is growing at twice the annual rate of non-Hispanics,” says Stacie de Armas, Arbitron’s director, Hispanic services. “Advertisers are taking note of the desirability of the Hispanic-American consumer. From 1998 to 2003, corporate spending on Hispanic advertising has nearly doubled to $2.7 billion.”
Hispanic-Americans are younger than the general population. More than half (52 percent) are married and more than half (55 percent) of Hispanic households have four or more members. More than one-third has at least some college education or more. Hispanics are more likely to be employed than the average American, with 14 million Hispanic adults employed full-time in the United States. The study also found that Hispanic-Americans are:
- 19 percent more likely to spend $500 or more on children’s clothing per year;
- twice as likely to spend $500 or more on athletic shoes per year;
- spending more on cell phones, with 9 percent spending over $100 per month on cell phone bills;
- seeing more movies than the average American and 81 percent more likely to see a movie in its opening week;
- more likely to take several trips outside the continental U.S. per year (in fact, they are 31 percent more likely to have taken five or more trips outside the U.S. within the last three years). The Arbitron Power of Hispanic Consumers Study 2004-2005 is available free at www.arbitron.com.
Americans like a good knockoff
Step aside Carrie Bradshaw, America’s brand loyalty is about as faux as that Louis Vuitton you bought in Chinatown! According to a survey by Chicago research firm Synovate, the majority of Americans are purchasing designer replica clothing, accessories and technology. Through interviews with 1,648 people worldwide, and 539 in the U.S., Synovate has uncovered that many Americans are purchasing counterfeit products - and even more disturbing: there is no guilt or social taboo associated with purchasing knockoff products as opposed to the real thing.
The first key finding was that most Americans have no issues buying imitation-brand clothing or accessories. Fifty-nine percent of respondents said that they had purchased an imitation brand-name product. When asked why they chose to purchase imitation products, almost 96 percent attributed their decision to the lower price of the replica product. The responses were not affected by an increase in household income or age.
The research also found that public perception is largely unaltered when it comes to buying counterfeit products. Ninety percent of respondents claimed that they would lose no respect for a person if he or she had a fake or imitation brand name product. A small percentage (slightly more than 1 percent) of those surveyed said that their respect for the person who purchased the imitation product would actually increase. Fewer Americans (30 percent) found something wrong with purchasing imitation products, such as purses, jewelry or imitation electronic products compared to the other regions surveyed, which included Hong Kong (71 percent), United Arab Emirates (47 percent) and Serbia (52 percent).
“It was astounding to learn that the U.S. population, arguably the world’s most sophisticated consumer market, displayed the least guilt about purchasing imitations,” says Tom Mularz, head of Global Omnibus, Synovate. “In an age where brand recognition is at its peak, consumers still seem to be focused on price versus quality. This, in turn, is creating pressure for original designers and manufacturers to communicate a negative association with lower-priced replica products.”
Synovate interviewed 1,648 respondents in the U.S., Serbia, United Arab Emirates and Hong Kong through online, telephone and face-to-face interviewing. In the United States, the company interviewed 539 people through eNation, Synovate’s national online research service. For more information visit www.synovate.com.
Small-biz owners not so confident in their confidence
Even though overall confidence in the economy has been dropping for the past three months (5.5 percent), confidence among small businesses still ranked higher than that of general consumers. In fact, according to the Small Business Confidence Index released by Sam’s Club, small-business confidence in the economy has outpaced that of general consumers for the past year by an average of 3.9 percent.
However, less than half (45.4 percent) of 1,200 small-business owners and managers polled in April 2005 said they were confident/very confident about the chances for a strong economy during the next six months. That reflects a confidence level drop of almost 7 percent compared to this time last year.
Sam’s Club also asked nearly 1,000 small-business owners and managers to rank expenses that are of most importance to their operations. Health insurance (43.1 percent) topped the list ahead of broadband access (35.9 percent), cellular phones (33.9 percent), business energy (gas, oil, propane, etc.) (31.7 percent), advertising (22.2 percent), accounting services (16.9 percent), voicemail (12.8 percent), dial-up Internet service (11.8 percent), financial planning services (8.3 percent), and collection services (7.8 percent). The index is available for viewing at www.samsclub.com.
Wal-Mart is tops with Hispanic-Americans
New York-based NOP World announced results from its Hispanic OmniTel Retail Study revealing where Hispanic-Americans are shopping and why. Asked to name their favorite store, Wal-Mart was far and away the top selection at 36 percent with JCPenney, Sears and Target tying for second place at 4 percent. While no one specific Hispanic store was selected by a significant percent of consumers, 5 percent of respondents named as their favorite a local store that caters to Hispanic-Americans.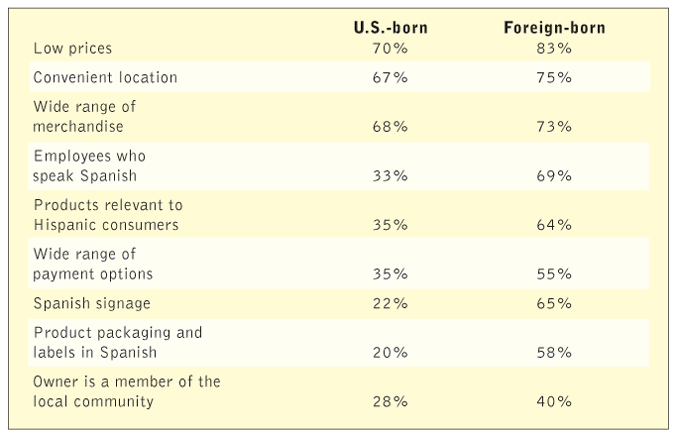
The study was conducted in February 2005 among 500 Hispanic-Americans aged 18 and older nationwide via telephone. Respondents were given the choice of completing the survey in English or Spanish.
Asked which factors are most important when deciding where to shop, Hispanic-Americans cited the same priorities that other Americans have when choosing retailers - convenience, low prices and a wide range of merchandise. However, a critical second-tier of priorities that is unique to the Hispanic market is cited by about half of Hispanics as being “very important,” including store employees speaking Spanish, products relevant to Hispanic consumers and Spanish-language signage. Following is a breakdown of factors considered very important in choosing a shopping destination:
- Low prices - 77 percent
- Convenient location - 72 percent
- Wide range of merchandise - 71 percent
- Employees who speak Spanish - 54 percent
- Products relevant to Hispanic consumers - 52 percent
- Wide range of payment options - 47 percent
- Spanish signage - 47 percent
- Product packaging and labels in Spanish - 43 percent
- Owner is a member of the local community - 34 percent\
Based on priorities of Hispanic shoppers it is no surprise that national discount chains such as Wal-Mart and Target are frequented even more often than local stores that specialize in serving Latino and Hispanic customers. Asked about their retail shopping habits, following is a breakdown of the types of stores respondents said they shop in often:
- national discount chain stores such as Wal-Mart or Target: 61 percent;
- local stores that specialize in serving Hispanic and Latino customers: 37 percent;
- national home improvement stores such as Lowe’s or Home Depot: 37 percent;
- national mid-priced department stores such as Kohl’s, Sears or JCPenney: 31 percent;
- specialty clothing stores such as the Gap or Old Navy: 19 percent;
- electronics, entertainment or appliance stores such as Circuit City or Best Buy: 17 percent;
- national upscale department stores such as Macy’s, Nordstrom or Lord & Taylor: 10 percent;
- sporting good stores such as the Sports Authority: 8 percent.
“The survey shows that mainstream national retailers such as Wal-Mart and Target are highly attractive to Hispanics, but that the key to differentiation stems from meeting and delivering the unique needs of Hispanic consumers,” says Brad Fay, managing director, NOP World’s Roper Public Affairs. “To stand out with Hispanics, retailers need to consider offering such things as Spanish-speaking sales clerks, Hispanic-oriented merchandise, and Spanish-language signage.”
Foreign-born respondents were significantly more attracted to the tailored offerings of local stores specializing in serving Hispanic customers, with 42 percent saying they often shop in these stores vs. 26 percent of U.S.-born Hispanics.
While both groups select Wal-Mart as their favorite store, the chart shows a breakdown of how their shopping priorities differ based on the factors they select as very important in deciding where to shop.
“One has to be careful to recognize that the Hispanic-American market is not a single market, but rather consists of a diverse set of consumers based on differences in language and country of origin, among other factors,” says Fay. “Unless marketers carefully study this segment, they take a significant risk of missing the mark.” For more information visit www.nopworld.com.
We seafood, we eat it
A survey by Harris Interactive reveals that 51 percent of U.S. adults who have ever eaten seafood say they are eating more seafood now than they did five years ago. Additionally, about two in five seafood eaters (41 percent) say they eat seafood because recent studies suggest it is healthy for the heart.
The survey, commissioned by Red Lobster, also discovered that:
More than three in four U.S. adults (77 percent) say they eat seafood at least once a month. Only about one in 10 (9 percent) say they never eat seafood.
The top two types of seafood frequently consumed by U.S. adult seafood eaters are shrimp (61 percent) and canned tuna (57 percent), followed by salmon (39 percent), crab (23 percent), fresh tuna (22 percent), cod (17 percent) and mollusks, such as mussels, clams or oysters (16 percent). Other types of seafood consumed frequently include: lobster (11 percent), halibut (10 percent), haddock (9 percent), rainbow trout (9 percent), tilapia (9 percent), snapper (8 percent) and grouper (4 percent).
About two-thirds of U.S. adult seafood eaters (67 percent) say they eat seafood because it is a welcome alternative to meat and chicken. Additionally, 68 percent note that they purchase seafood such as salmon, shrimp and sushi at their local supermarket or grocery store. For more information visit www.harrisinteractive.com.