
••• alcoholic beverage research
Beer drinkers happy to be awash in choices
Tastes change with the season
 What a time to be alive – at least according to beer drinkers. Nearly nine in 10 (88 percent) beer drinkers agree that it’s a great time to be a beer lover. When looking more closely at what it is about beer they love so much, 70 percent say they enjoy trying new types of beer and nearly two in three (64 percent) are fans of local brews. The latter is especially true of craft beer drinkers, 86 percent of whom are fans of local beer, compared to 77 percent of those who prefer import beers and 60 percent of domestic non-craft beer drinkers.
Those in their 30s stand out from the crowd in their passion for beer. Among beer drinkers in this age group, 95 percent say it’s a great time to be a beer lover and 85 percent enjoy trying new types of beer. They’re also more passionate fans of local brews than the average beer drinker (76 percent).
These are some of the results of The Harris Poll of 2,115 U.S. adults (ages 21 and older), including 913 who drink beer at least several times per year, surveyed online.
As the weather changes, so do the taps, with spring seasonal brews replacing the winter drafts. When it comes to beer style, lagers are tops, with 30 percent of beer drinkers saying a lager is their preferred choice. However, 40 percent of beer drinkers say their favorite beers change with the season. Millennials may welcome the change most as they’re more likely than any other generation to modify their tastes with the seasons (56 percent vs. 42 percent Gen Xers, 26 percent Baby Boomers, 21 percent Matures).
“It’s certainly a good time to be a beer lover,” says Danelle Kosmal, VP of Nielsen’s Beverage Alcohol practice. “As Americans continue to enjoy some of their favorite traditional lagers, they also have a seemingly unlimited set of options when it comes to styles and new flavors. Whether it’s with a new session IPA, a farmhouse ale or a refreshing summer flavor, there are plenty of reasons for beer lovers and brewers alike to be excited about their opportunities in beer.”
Perhaps just as critical as the contents of your pint glass is what’s on the plate next to it. Pizza tops the list of foods beer drinkers say is the best to eat while sipping a cold one (28 percent), which comes as no surprise since a separate Harris Poll found that pizza also ranked as the No. 1 comfort food and beer beats out all other alcoholic beverages as the top alcoholic beverage to wash down a slice. Burgers (10 percent) and wings (7 percent) round out the top three favorite foods to pair with a beer.
This Harris Poll was conducted in English, within the United States between February 17 and 22, 2016 among 2,115 adults (aged 21 and over), among whom 913 drink beer at least several times per year. Figures for age, sex, race/ethnicity, education, region and household income were weighted where necessary to bring them into line with their actual proportions in the population. Propensity score weighting was also used to adjust for respondents’ propensity to be online.
Respondents for this survey were selected from among those who have agreed to participate in Harris Poll surveys. The data have been weighted to reflect the composition of the adult population. Because the sample is based on those who agreed to participate in the panel, no estimates of theoretical sampling error can be calculated.
••• the internet of things
Convenience, security main benefits of a connected home
Some privacy worries
 Consumer awareness of the connected home is growing quickly, according to findings released from connected home studies that were fielded by Kelton Global and Research Now in the U.S. earlier this year. Commissioned by Nest, the studies were designed to uncover consumer sentiment about the connected home market. Findings include: 81 percent of Americans either own or are interested in purchasing a connected home product in the next year; to Americans, the main benefit of having a connected home product is increased convenience (54 percent), followed by increased security (44 percent), a reduced energy bill (38 percent) and boosted home value (21 percent); 38 percent of Americans are more interested in connected home products today than they were six months ago.
The increased interest is also reflected in the retail environment. “Connected home products like the Nest Thermostat are among one of the fastest-growing categories in the retail environment,” says Amanda Parrilli, director of connected home, Home Depot. “And considering the connected home is really just starting to take off, the potential for the market is incredibly exciting.”
The average connected consumer is family- and home-oriented. An overwhelming 89 percent said spending time with family is their first priority, yet approximately half (51 percent) rarely have enough time in the day to do all they need. Perhaps that’s why 63 percent wish that their home could just take care of itself. Fifty-six percent feel it’s more important that their home is comfortable than looks good and 73 percent love their home and want to live in it for a long time.
Increased safety and security continue to be compelling reasons to integrate connected home technology, with 44 percent of Americans indicating this as a key benefit of having connected products. Fifty-four percent value the convenience they offer, such as the ability to monitor and control their home from anywhere.
Environmental benefits and reducing monthly bills and are also key motivators for consumers to install connected home products, with 38 percent pointing to reduction in home energy bills as a benefit. Fifty-nine percent of Americans also indicated they worry about their energy consumption.
Despite growing awareness of connected home products like thermostats, Americans are concerned about keeping their personal information secure online (82 percent) and worry that the technology in their home will quickly become outdated (43 percent). Understandably, they are willing to pay extra for high-quality electronics in their homes (63 percent). Bottom line, Americans just want the technology in their home to work well together (86 percent).
Awareness of connected home brands gradually increases with household income levels. However, across multiple income levels, more than half of Americans can name at least one connected home brand. When asked which brands in the “connected or smart home” space came to mind, 21 percent named Nest as the top brand, followed by Apple (12 percent) and Samsung (8 percent).
The Kelton Global/Nest Connected Home Survey was fielded between April 18, 2016 to April 20, 2016 among 1,018 nationally representative Americans ages 18 and older. Quotas were set to ensure a reliable representation of the U.S. population 18 and older. The margin of error for this study is plus or minus 3.1 percentage points.
Additionally, Kelton Global conducted seven studies of home electronic brand and product awareness from August 5, 2013 to January 5, 2016, with 500 to 1,000 responses per study consisting of Americans ages 25 to 65. All survey participants are homeowners, decision-makers in their household about energy, own smartphones, have a household income of $60,000 or more and are engaged with technology. The margin of error for these studies ranged from plus or minus 2.0 to 3.4 percentage points.
The Research Now/Nest Connected Home Survey was fielded between January 22, 2016 to January 25, 2016 among 614 geographically-representative U.S. homeowners, aged 25 to 65, who are decision-makers in their household about technology and have a household income of $60,000 or more. The margin of error for this study is plus or minus 3.9 percentage points.
••• consumer psychology
Clean home = healthy home
Housecleaning is more than de-cluttering
A new consumer survey confirms that spring is the favorite time of year for home cleaning, with 45 percent of people cleaning during the spring season. But it turns out that spring cleaning is about much more than just organizing and de-cluttering. The survey found that one of the primary motivators for deep cleaning was to eliminate unhealthy elements from their homes. In short, people clean for their health.
Harris Research Inc., the parent company of  carpet and upholstery cleaning franchise Chem-Dry, conducted the independent national survey to determine the motivations behind cleaning habits and the importance of healthy home environments for families. The survey included nearly 700 participants, both men and women, ranging in age from 18-55 across various income levels around the country.
While appearance of the home and peace of mind were the two top cleaning motivators among all respondents, health reasons topped the list for women ages 25-34. Among that group, more than 30 percent reported “health of their family” and eliminating unhealthy elements such as bacteria and allergens as the top motivators.
While 38 percent of people feel the air inside their homes is cleaner than outside, 46 percent feel that indoor elements like dust, pet dander and mold are major triggers for asthma and allergy attacks.
Respondents reported allergies are a year-round occurrence but spring was ranked by the largest portion of people – 31 percent – as the time of year when allergies and asthma most act up.
Eight out of 10 respondents believe home cleaning is one way to effectively remove allergens and alleviate symptoms and when asked what part of the home they focus on most to remove allergens, the top response was the flooring – carpets, rugs, tile and other flooring.
••• financial services
College students acing money management
Wise beyond their years?
Conventional wisdom says young people have a lot to learn when it comes to managing money but the reality is most American college students are handling their finances carefully and conscientiously, according to Majoring in Money: How American College Students Manage Their Finances, a new national study from college-funding company Sallie Mae and researcher Ipsos.
The study compiles the results of online interviews of 800 college students between the ages of 18 and 24 and reveals students are taking the right steps when it comes to managing money. More than three-fourths (77 percent) of college students pay bills on time; six in 10 (60 percent) never spend more money than they have available. In addition, college students are putting money aside each month. More than half (55 percent) save at least some money every month and 24 percent report having an emergency fund.
While most college students make purchases with debit cards (85 percent), cash (86 percent) and mobile payments (77 percent), more than half – 56 percent – have at least one credit card. In fact, roughly six in 10 (59 percent) report their primary reason for getting a credit card was to build their credit history. The study also finds that the majority of students with credit cards are using them responsibly and paying the bill themselves. Specifically, 63 percent pay the balance in full each month and 73 percent pay the bill without assistance from a parent or other adult. Roughly seven in 10 (69 percent) report an average monthly balance of $500 or less.
 “Having a credit card doesn’t necessarily mean students are overspending,” says Julia Clark, senior vice president, Ipsos Public Affairs. “The reality is they are demonstrating sound reasoning and thoughtful decision-making and they are managing their payments effectively.”
The research shows that most college students understand the value of good credit and the majority know how to get and maintain it. Nine in 10 college students (91 percent) know having a good credit record can help them qualify for different types of credit and improve their access to favorable interest rates. The majority know paying bills on time (93 percent) and keeping credit balances low (63 percent) are positive credit behaviors and opening multiple credit accounts simultaneously (64 percent) and using as much credit as possible (61 percent) are negative credit behaviors.
While the majority of college students express confidence in their current money management skills, 83 percent would like to learn more, especially about saving and budgeting. College students would also benefit from additional education around specific credit topics, including how interest accumulates and how repayment behavior and credit terms affect the cost of credit over time. In fact, when asked to answer multiple-choice questions on those topics, only 31 percent answered all three questions correctly.
••• retailing research
Study finds blurring of retail categories
Buying groceries at a non-grocery store
 As reported by Progressive Grocer, the third annual Consumer Insights research survey conducted by retail design firm King Retail Solutions (KRS), in collaboration with A.R.E.|POPAI, highlights the continued evolution of category blurring across retail channels.
The survey sampled over 1,200 diverse U.S. residents including Millennials, Gen Xers and Baby Boomers about their shopping habits and attitudes toward a multitude of retail sources. With three years of data available, the 2016 study focuses on year-over-year analysis, new trends and ongoing shifts in consumer preferences.
Once again, the 2016 survey dives into the growing trend of category blurring. Quality and selection continue to increase in importance for purchases of fresh meals, groceries and apparel. A new area of attention for the 2016 research study focused on special-occasion purchases highlighted as a growing trend for a wide variety of retailers.
Study highlights include:
Online for in-store pickup: 54 percent of U.S. shoppers find the option to buy merchandise online for in-store pickup appealing and have done so in the past 12 months. That’s up 14 percent from 2015 responses. Thirty-four percent said they would purchase groceries online for in-store pickup. Forty percent of men would buy groceries online for in-store pickup while only 29 percent of women would do so; 47 percent of Millennials, 33 percent of Gen X and 21 percent of Baby Boomers would buy groceries online for in-store pickup.
Grocery category-blurring: 65 percent of U.S. shoppers bought groceries from a non-grocery store in the preceding 12 months and 91 percent would consider doing so in the coming 12 months. As income increases, so does the likelihood of having purchased groceries from a non-grocery store. Canned/boxed foods are the grocery category most likely to have been purchased from a non-grocery store. Big-box stores and dollar stores are the non-grocery retailer types consumers are looking to most frequently for their grocery purchases.
Whether at a grocery store or another type of retailer, KRS consumer panelists ranked their decision-making factors in choosing where to purchase groceries as follows: cost; quality; selection; convenience; the shopping environment/experience; and access to non-grocery items also sold.
Aside from restaurants, grocery stores are the most popular outlet consumers are turning to most frequently for their fresh prepared meal purchases. Kroger, Albertsons/Safeway, Publix and Ahold were the top grocery store brands ranked for fresh prepared meal purchases among KRS study participants.
Special-occasion category-blurring: Big-box (51 percent), dollar stores (47 percent) and grocery stores (40 percent) are the most popular outlets KRS survey panelists turn to most frequently for their special-occasion purchases. Kroger, Albertsons/Safeway and Ahold were the top grocery store brands ranked for special-occasion purchases, including flowers, balloons, gift wrap and greeting cards.
Retail subscription services: 28 percent of U.S. shoppers have participated in an ongoing subscription retail purchasing agreement in the past 12 months – up 6 percent from 2015 responses. In terms of grocery, the No. 1 retailer mentioned among subscribers is Amazon, whose pantry penetration is rising as a competitor to traditional grocery stores. Other retailers offering grocery items by subscription include: Target, Walmart, Graze and Naturebox.
••• wearables research
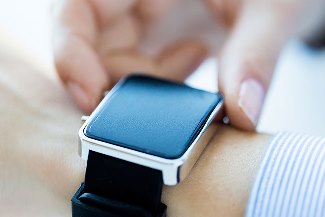
Consumers confused yet intrigued by wearables
A good kind of nerdy
A nationwide survey of 1,060 American consumers conducted by Cincinnati-based loyalty firm Colloquy shows that 63 percent say wearable devices are too expensive. Just over one out of every two Americans, 52 percent, say they don’t know enough about wearables and don’t understand them. On the other hand, 35 percent of consumers said wearable technology is nerdy but “cool nerdy.” In a stat that retailers undoubtedly will embrace, one in four Americans, 27 percent, said they “used to hate shopping but with my wearable I love it.” And just 8 percent said wearable devices are uncomfortable.
Wearables consist of clothing or accessories that integrate technology into consumers’ everyday lives in fun and practical ways. Whether it’s fitness trackers, eyewear, smart jewelry, a dress that posts to social networks or shorts that upload workout stats, it’s fair to say that Americans are still shopping. They are guessing whether prices will go down and wondering if they’re ahead of, or behind, the fashion curve. They’re still doing their research. And some are concerned about age appropriateness.
Key wearable variables: 33 percent said wearables make a fashion-forward statement; 41 percent said “I’d be more likely to place a wearable on my pet than on myself”; 36 percent said wearables are a passing fad; 58 percent said “I’d like to use a wearable device but I’m too old”; and 35 percent said people who use wearable devic-es are just trying to show off.
 “Wearables work on several levels for retailers. Keep it fun. Keep it dynamic and court the mighty Millennials,” Colloquy Research Director Jeff Berry says. “Retailers should consider sending one-to-one, targeted offers to shoppers’ wearable devices, including on-the-fly pricing adjustments based on inventory and even time of day.”
Additional survey results show that consumers registered only modest concerns about the functionality of wearables: 9 percent said wearable devices have to be charged too often; 6 percent said wearables are not compatible with other devices; and 4 percent said wearables have slower processing times than other devices.
The Colloquy survey results are based on an online survey taken in February 2016 of 1,060 American consumers. The margin of error is +/- 4 percent at the 95 percent confidenc