Like father, like son
What kind of son would pass up a chance to be compared to his father? Men's Health magazine wanted to know how today's American male measured himself against the example set by his dad. A nationwide telephone survey of 508 men conducted by Opinion Research Corporation, Princeton, N.J., yielded findings that the magazine developed into a report called "Father Knew Best." Not too surprisingly, the survey's findings indicate that paternal stories about walking 24 miles to school through waist-deep snow will likely continue to be told for years to come.
Over two-thirds of the men polled (70%) believe it is harder for them to be fathers than it was for the dads. This feeling is especially strong among African-American men: Of those questioned, 82% stated that it is more difficult to be a father in today's society. Similarly, among aging baby-boomer men (ages 45 to 54), three-fourths of those surveyed (76%) believe it is harder to be a father now.
The Men's Health survey also found that nearly half (46%) of the men questioned believe it is more difficult to succeed now than it was for their fathers. Another 16% agreed that the difficulty of achieving success is "about the same," while 36% stated that it is easier to succeed now.
Curiously, 64% of the African-American men polled said it is easier to succeed today, while only 32% of white men and 37% of Hispanic men said they think it is easier. Similarly, 49% of white men said it is harder to succeed, compared to 30% of black men.
Despite their belief that it is harder for them to succeed than it was for their dads, most men feel they are more successful than their fathers were. The survey found that 52% of the men questioned believe they are more successful than their fathers were at the same age. Another third (31%) believe they are about the same in terms of success, while 13% of the men said they are less successful.
Younger men, however, are least likely to rate themselves as more successful than their dads, with less than half (43%) of those aged 18 to 24 stating as much. The greatest percentage of men rating themselves as more successful was found among those aged 55 to 64, with 60% of those questioned saying they've achieved more success than their fathers did.
The survey discovered that while men in general said they admire their fathers "a lot," many have reservations about being like them. For example, three-fourths (76%) of the men questioned said they admire their fathers "a lot." Another 14% said they admire their dads "somewhat." Less than 10% of those polled said they admire their dads "a little" (6%) or "not at all" (3%). The one exception was among younger men (18 to 24), only 65% of whom said they admire their dads "a lot."
At the same time, when asked how much they try to be like their fathers, 66% said "a lot" or "somewhat" - compared to the 33% who said they try only a little or not at all. Only 29% of the men polled said they try a lot to be like their dads.
In the survey, 44% of the men polled claimed they spend more time with their families than their fathers did. Yet 49% of those surveyed said they still think they don't spend enough time with their spouse and/or kids.
Finally, regardless of the pressures of a tight economy and the modern era's requirement that both parents work, men rate the quality of their lives as higher than the quality of theirfathers'. Among those surveyed, over two-thirds (67%) said the quality of their lives is much (38%) or somewhat (29%) better than was their dads' at the same age. In fact, only 10% said it is somewhat or much worse.
The improved quality of life is reflected in how men rate their health in comparison to their fathers'. For example, while 37% of the men surveyed rate their health as better and 49% rate it as about the same as their dads', only 12% say it is worse. Similarly, 79% said their relationship with their spouse is either better than (39%) or about the same as (40%) the relationships their fathers had with their mothers. Only 10% said their relationships with their wives are worse.
The Men's Health survey was conducted during the week of May 3,1993, and has a margin of error of plus or minus 4%.
Seniors are viable apparel market
In analyzing the clothing spending patterns of nearly 3,000 elderly consumers, Hazel Ogilvie Jackson, assistant professor of textiles and clothing at Ohio State University, has found that advancing age alone does not cause people to scale back their clothing purchases. Her findings challenge the notion that when people reach a certain age, they cease to care about how they look and therefore aren't a viable market for apparel.
Taken in tandem with recent demographic trends, these findings could signal a new sensitivity toward the elderly on the part of the clothing industry, Jackson says.
"The number of people 60 and over is growing at twice the rate of the population as a whole," she says. "This population probably represents increasing purchasing power and a growing market."
In her study, recently published in the Clothing and Textiles Research Journal, Jackson examined consumer purchase diaries and questionnaires completed as part of the federal government's 1984 Consumer Expenditure Survey. The study involved 2,927 households headed by someone 60 or older. Each head of a household kept a purchase diary for two consecutive weeks and was interviewed about his or her spending habits every three months for 15 months.
In analyzing the purchases of these senior citizens, Jackson found that there is little relationship between age and spending level - at least until about age 80. She says that improved physical and economic health among today's elderly are likely responsible for this. Jackson also found - not surprisingly - that the affluent elderly tend to spend more money on clothes than others. But she says that income level alone cannot fully explain purchase decisions among the elderly.
Over the years, Jackson says, the erroneous assumption that the elderly stop buying clothing has resulted in apparel product lines that offer few choices to elderly consumers. She hopes that her research will be a first step toward reversing this trend. Jackson plans to look more closely at clothing purchases of the elderly in future research. She also believes that retirement, income changes, marital status and household size - as well as income - all likely work together to influence purchases.
Kelly Food-service companies repelled by giants
Food-service manufacturers generally refrain from entering product categories in which the leading two brands have a combined market share of 25% or more. Foodservice Research Institute, Oak Park, Ill., analyzed 80 product categories after interviewing 3,500 food-service operators for its syndicated survey titled Brand Equity Share. The company's findings would seem to indicate that unless you have innovative packaging, a new delivery system or a new product form, it is unwise to attempt to gain ground in a product area dominated by one or two names.
Still, while such a situation may be intimidating at first blush, Joseph E. Brady, managing director of Foodservice Research Institute, says that initial impressions might be deceiving, and that it's difficult to tell whether it is best to compete in a category that is heavily, moderately or slightly dominated by one or two manufacturers. "Profit opportunities exist in all areas," Brady says. "In fact, it might even be more profitable having a small share of a large category than having a large share of a small category."
Of the product areas Foodservice Research Institute examined, dominance by the top two brands varied widely. The canned soup (with 87% held by the top two names), ice cream cone (62%) and rice (60%) markets proved to be the most strongly controlled by the top pair.
Mexican marketers head north after NAFTA
Even before NAFTA made it over Capitol Hill, Mexican producers of con-sumer goods planned to step up marketing efforts in the United States, a FAX poll conducted by Strategy Research Corp. (SRC), Miami, Fla., shows. The poll - described in the January 1994 issue of SRC's newsletter, Inside Strategy - was conducted just before passage of NAFTA in the U.S. House. It surveyed Mexican producers who were believed to be exporting to the United States, asking them about their future marketing and sales efforts - with or without NAFTA.
The results show that the passage of NAFTA will bring a strong increase in marketing and sales efforts to both the U.S. Hispanic market and the U.S. market in general. Of the companies polled, 95% are currently exporting consumer products to the United States. More than half of those companies are targeted primarily at the U.S. Hispanic market; 22% of the companies say the majority of their products' sales are in the Hispanic market, 33% say the majority of their sales are equally split between the U.S. Hispanic and general markets. The products produced by the companies in the poll ranged from Mexican arts and crafts to tequila and wine.
Even if NAFTA did not pass - and at the time it appeared that the agreement would not win approval - 32% of the Mexican firms polled said they planned to increase their sales and marketing efforts in the United States during the coming years. Now, with the successful passage of NAFTA, the following can be expected:
Almost four-fifths of the producers surveyed will increase their marketing efforts in the United States. Only 10% will decrease such efforts and about the same portion will stick with what they've got going now. Of those companies that will increase their efforts, 53% say they will step up their efforts a lot; 33% will bump up somewhat; and 13% say they will increase activities minimally.
Many Mexican producers of consumer goods mentioned that they consider the U.S. Hispanic market to be the natural market for their goods in the United States - and with a comparative advantage in Spanish-language packaging and advertising already, they stand to give U.S. producers of consumer goods a run for their money in the Hispanic market.
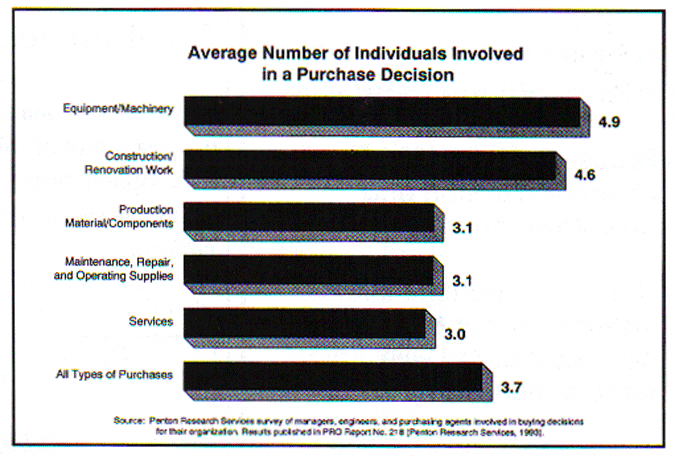
Decision-makers remain elusive
Business and government purchase decisions are usually made by a group, not an individual. According to a survey done by Cleveland-based Penton Research Services, the average number of people involved in a buying decision ranges from about three, for services and items used in day-to-day operations, to almost five for high-buck purchases such as construction work and machinery.
Further, Penton found that twice as many people are involved in purchases at large plants and offices than at small operations. For example, a decision to contract out for a service is normally made by a group of two or three at an office with fewer than 100 employees. Five or six people will be involved in the same kind of decision when it takes place at a location with 1,000 or more employees.
It's not going to get any easier for sales reps. A Center for Advanced Purchasing Studies survey found that 87% of the purchasing executives at Fortune 1000 companies expect teams of people from different departments and functions to be making buying decisions in the year 2000. Only 60.8% of the same group said that teams are currently making sourcing decisions.
Penton publishes its survey findings in a series of what they call Research Overview Reports.
Meet the techthusiasts
Experts say high-tech products such as VCRs, personal computers and CDs are just a hint of things to come in the fiber-optic/interactive world of the near future. A recent issue of the Bruskin/Goldring Research Report, addresses the question of how new technologies will affect Americans' product and media consumption - a question of vital importance to ad agencies and advertisers.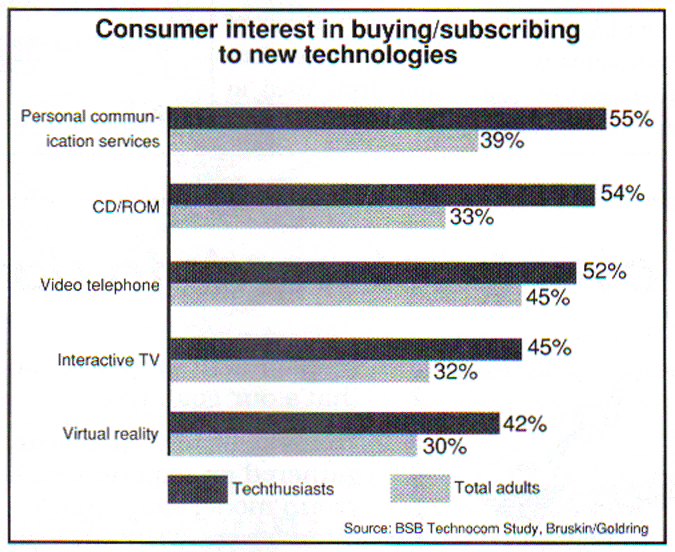
Backer Spielvogel Bates (BSB) commissioned Bruskin/Goldring to investigate the purchase potential of the next generation of technologies for a BSB report called "Projections: 2002." The study analyzed developments in personal-use, consumer-oriented technologies and Americans' receptivity to advertising for such systems.
The BSB study identified consumers most likely to use new technologies. These so-called "techthusiasts" are technology enthusiasts and early adopters of today's electronic devices. Comprising 20% of U.S. adults, techthusiasts boast a median household income of $56,500 - almost two-thirds more spending power than the average household. They are better-educated than the average adult (14.1 median years of schooling vs. 12.7 years) and their me-dian age is nearly three years younger than that of the average adult.
Techthusiasts are more likely than the general population to have electronic audio and video equipment. For example, almost all (97%) techthusiasts own a VCR, compared to 79% of total adults; more than two-thirds own a personal computer and a CD player, compared to less than a third of total adults; and half of all techthusiasts own a computer modem, versus only 12% of total adults. They are early purchasers of new home appliances and new food products, indexing 246 and 201, respectively, against total adults.
Techthusiasts are eager to use new technologies, with more than four in 10 saying that they will purchase or subscribe to interactive TV, virtual reality, personal-communications services, video telephones, or CD-ROM devices. Although the general adult population is also interested in these tech-logics, no techthusiasts are between seven and 21 points more likely than total adults to anticipate continuing to be high-tech consumers. While techthusiasts are most interested in personal-communications services, total adults are most interested in video telephones. Techthusiasts are also more likely than total adults to accept limited amounts of advertising through these technologies, but both groups are somewhat receptive.
Marketing textbooks are filled with examples of electronic innovations that never caught on with the American consumer. Will these new products join 8-track tape players, subscription over-the-air TV decoders and Betamax machines in America's electronic attic? Craig Gugel, senior vice president and executive director of media research and technology for BSB doesn't think so. He predicts that systems with the strong backing of the telephone, cable and entertainment industries are some of the probable winners. "Personal-communications services (PCS), interactive TV and CD-ROM are the technologies most likely to succeed," Gugel says.
Beverage drinkers clearly unimpressed
Consumers' verdict on clear beverages is thumbs down by almost two to one, according to a recent issue of The Shopper Report, published by the Consumer Network, Inc., a Philadelphia-based research organization that maintains a panel of 5,000 shoppers drawn through retail outlets throughout the United States. In the October 1992 issue of the newsletter, Consumer Network head Mona Doyle predicted that clear drinks soon would go flat with consumers. Now consumer research is proving her sagacious. The see-through beverages have a fundamental problem: They don't taste as good as their colored counterparts. Consumers like the concept of no added coloring, but the reality disappoints them. Some see it as a silly fad. Others are worried about accidentally drinking Palmolive instead of Pepsi. Still, enough Consumer Network panelists enjoyed the clear drinks to suggest that they will, at least, stay on shelves for a while longer.
Interactive media booming
The 11th annual Communications Industry Report, released last December by the investment banking firm of Veronis, Suhler & Associates Inc., New York, N.Y., indicates that the high-tech communications and interactive media industries are indeed booming. Although unable to match the double-digit growth of the boom years - 1989 to 1990 - key financial indicators for the nation's 349 publicly reporting communications industry companies grew significantly in 1992, according to the report.
After a disappointing 1991, an improved economy - aided by restructuring and rigid cost controls - helped boost the industry's overall revenues by 6.4% to $137.1 billion. Operating income rose 17.5% to $18.1 billion. Following a decline of 4.8% in 199 operating cash flow zoomed 12.1% to $27.4 billion.
The average operating income margin for all publicly owned communications companies reached 13.2%, up 1.2 points over 1991, and the average cash flow margin climbed 1 point to 20%. The substantial 1992 margin gains compensated in large measure for sharp declines in 1990 and 1991, when margins for both operating income and cash flow fell.
Included for the first time in the industry results were 30 interactive digital media firms. These companies provide software for consumer reference, education, games, and consumer data and transactions, along with home shopping and infomercials. The Report notes that this emerging industry is significant to the communications industry as a whole not only because it provides investment opportunities, but because of its potential impact on the traditional media.
The interactive digital media segment showed impressive growth in 1992, the report says. The 30 publicly reporting software companies paced the entire industry in '92, with revenues growing 20.6%, operating income up 55.5 %, and operating cash up 36.5%.
Veronis, Suhler's Report, covering 1988 to 1992, is designed to enable senior officers of corporations and financial institutions to examine in detail the financial performance of all 349 publicly reporting companies in radio and television broadcasting, cable television, filmed entertainment, recorded music, newspaper publishing, book publishing, magazine publishing, business information, advertising agencies and - for the first time - interactive digital media.
Clinton makes executives nervous
Apparently the president is making executives nervous. A couple of Clinton administration initiatives topped the list of the most pressing concerns of American business executives in 1993, according to FIND/SVP, a consulting and research firm based in New York City.
Based on a review of the tens of thousands of questions posed to its consultants during the past year by some 2,000 client companies, FIND/SVP reported that health care reform appeared to be the chief concern of U.S. business in 1993, as clients sought information on what the Clintons' health proposal entailed, how it would affect their companies or industries, and who would emerge as winner and losers if the proposal were passed. Requests came from all kinds of companies - the gamut stretched from insurance companies and banks to ad agencies and investment firms looking to profit from the plan's provisions.
Close on its tails in terms of importance to U.S. firms was the Family and Medical Leave Act (FMLA), which was signed on February 5, 1992, and took effect on August 5. It provides eligible employees with up to 12 weeks of unpaid leave for events such as childbirth, adoption, and illness, or if a parent has to care for a seriously ill family member. FIND/SVP clients wanted to know how their companies should go about drafting their own FMLA policies; where they should post notices; and how health care payments should be handled when an employee is on leave. Record-keeping requirements were also a subject of inquiry.
Rounding the list of the year's most popular business topics, according to FIND/SVP's experts, were the education crisis, the so-called electronic superhighway, NAFTA, women's health issues, Internet, brew pubs and microbreweries, casino and riverboat gambling, and electronic tax filing.
FIND/SVP' s consultants said the next 10 most popular topics with its clients were the 1996 Olympics and 1994 World Cup (both of which will take place in the United States), "ultra" laundry detergents, corporate-sponsored child care, rugged casual footwear, "generation X," guns and ammunition legislation, home-shopping networks, electric and gas utilities, gourmet coffee bars and entertainment retail stores, such as those opened by Disney and Warner's.
Cereal continues to pour
In 1992, the ready-to-eat cereal market grew 5.4% (in terms of retail dollars) to tally sales of $8.14 billion, according to Packaged Facts, New York, N. Y. Volume grew at a somewhat slower rate, rising 3.8% to hit 2.75 billion pounds.
Throughout the 1980s, annual dollar gains (which hovered around double-digits) were usually 200% to 300% higher than pound increases. So despite the fact that dollar gains exceeded pound increases by over 40% last year, 1992 actually marked an advancing equity between the two growth rates. This is probably a result of the increasing popularity of private-label brands putting downward pressure on prices.
The slowdown in price increases may simply have been inevitable after the blistering pace of the '80s. From 1983 to 1992, the average per-unit price of ready-to-eat cereal rose 67%. Much of that increase was simply due to across-the-board price raising. But a great marketing effort was also instrumental in the up-scaling process. Many new niches were uncovered and eploited to their fullest as marketers mounted appeals to consumers from every conceivable angle.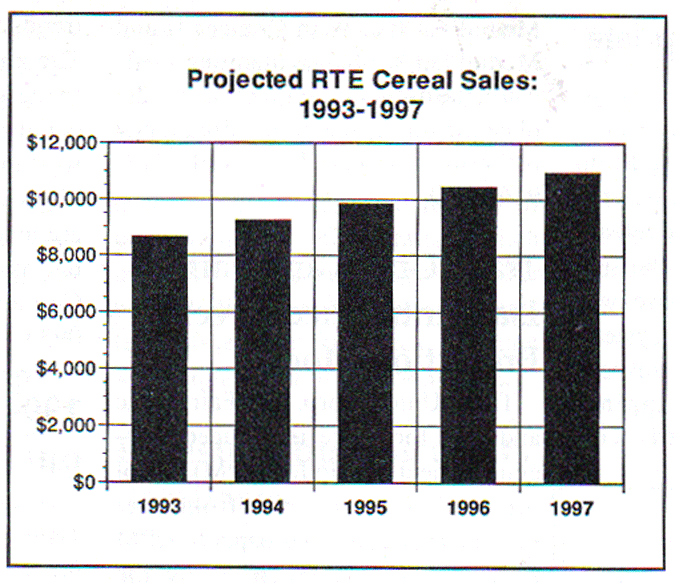
The segments best-suited to such targeting, however, continued to exhibit the strongest growth in 1992. Presweetened, a segment with a great deal of cartoon advertising and motion-picture tie-ins, was up 7.7%. Three health-oriented segments (bran, nutritional, and natural) all grew more than 5%. Those numbers are in marked contrast to the fate of the "regular" segment, which gained only 1.9%, well below the 5.4% gain posted by the category as a whole. Packaged Facts is predicting, however, that the regular segment will spring back this year.
By the end of 1993, the regular segment is projected to gain a healthy 6%, which will bring its sales up to $2.5 billion. Presweetened is projected to grow 7% to $4.18 billion. Bran and nutritional are expect to grow 4% each, reaching $1.01 billion and $677 million, respectively. But despite the across-the-board gains, the real glory still belongs to a niche, as the natural segment is expected to grow 10% to reach sales of $268 million. This will bring 1993 total sales to the $8.64 billion mark, a gain of 6% over 1992.
The annual growth rates of the various ready-to-eat cereal segments are projected to remain relatively constant through 1997. Forecast totals for that year are: presweetened up 5% to $5.48 billion; regular up 3% to $3.13 billion; bran up 4% to $1.12 billion; nutritional up 5% to $823 million; natural up 10% to $405 million. Packaged Facts predicts that the market in general will go up 5% to reach total sales in 1997 of $10.95 billion.