Are you ready for some football?
Three cities top the nationwide standings with the highest percentage of die-hard National Football League (NFL) fans. According to a study by New Yorkbased Scarborough Sports Marketing, the cities containing the highest concentration of avid NFL fans are Milwaukee (38 percent), Jacksonville, Fla. (37 percent) and Kansas City (33 percent). One-third or more of the adult population in these three cities are "very interested" in the pigskin pastime compared to the national average of 23 percent.
How do cities without a home team rank? The NFL scores high in Sacramento, Calif. (30 percent), Las Vegas (29 percent), San Antonio, Texas (29 percent), and Fresno, Calif. (29 percent). However, most cities without an NFL team are not home to football fanatics. In Lexington, Ky. (11 percent), Greenville, S.C. (16 percent), and Portland, Ore. (17 percent), less than one-fifth of residents are die-hard NFL fans.
"Cities with successful teams and high profile players naturally have a greater concentration of avid fans," says Evan Goldfarb, senior vice president, Scarborough Sports Marketing. "Specifically looking at the St. Louis Rams, the 1999 Super Bowl champions, their current ranking is at an average avidity level. This measurement time period includes the 1999 season and I anticipate this percentage to climb in future studies in light of their recent successes."
The Scarborough study revealed that avid NFL fans tend to be between the ages of 18-34 (34 percent), male (69 percent), well over half own their own home (66 percent), and their average household income is $59,585 per year. Avid NFL fans tend to be computer-savvy with 63 percent owning a home computer and almost a quarter of them using the Internet to keep up with sports scores (26 percent).
The data for this report was compiled from August 1999 to March 2000 from release one of the 2000 Scarborough six-month database. Scarborough Sports Marketing measures local market consumer and lifestyle information by interviewing over 85,000 adults (ages 18+) in 64 U.S. markets including all professional sports markets. Scarborough’s sports measurements focus on four key areas: fan avidity; multimedia measures including sports viewing and listening; corporate sponsorship information including fans’ shopping and product/service usage; and leisure time activities.
Cleanliness, price top list when choosing lodging
Cleanliness isn’t just important, it is the number one feature that travelers look for when deciding where to stay, according to a survey by the American Automobile Association (AAA), Orlando, Fla.
The survey, conducted by AAA Market Research, named the top five factors in choosing an accommodation. Those identified factors are:
- Cleanliness – Guests want rooms and common areas to be thoroughly cleaned and well maintained with all equipment in good working order.
- Price/value – The cost should reflect guest expectations in terms of amenities and décor. Quoted rates should match advertised discounts and benefits.
- Location – Proximity to business or leisure-related activities is highly valued.
- Room amenities – Movies, coffee maker, hair dryer, and iron and ironing board were mentioned most often by survey respondents.
- Professional, friendly service – Housekeeping and other reasonable needs should be provided on request, and the staff should have a neat appearance, operating professionally and ethically.
Survey respondents stayed in Diamond Rated accommodations an average of 3.3 times in the last 12 months and 84 percent of them used AAA’s TourBook guides to choose those accommodations. Additionallyl, 95 percent of respondents agreed with the assigned AAA Diamond Rating.
Weekday meals made in a hurry
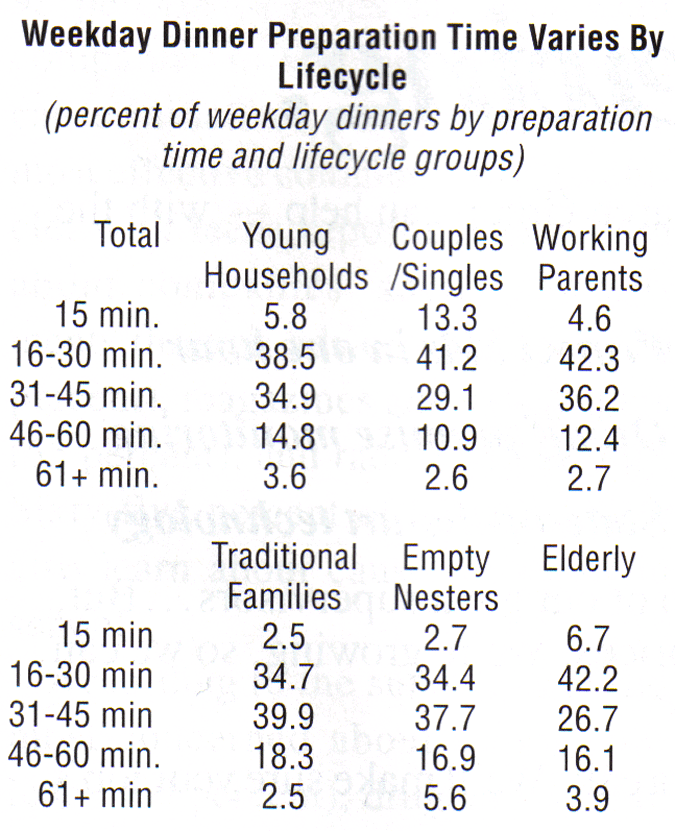
Forty-four percent of weekday meals are prepared in 30 minutes or less according to a new study by The NPD Group, Inc., a Port Washington, N.Y., research firm. People are preparing quicker meals and spending less time in the kitchen, confirms NPD’s latest Kitchen Audit, a survey of 2,000 nationally representative households.
While younger couples/singles, working parents and the elderly skew to quicker meal preparation (16-30 minutes), traditional families are apt to spend more time preparing an average weekday dinner (31-60 minutes). NPD data show that although people are increasingly simplifying weekday meal preparation, they are willing to spend more time on weekend meals, taking an average of 31-45 minutes for meal preparation.
Not surprisingly, some traditional kitchenware is becoming less popular. Since 1993, the percentage of American households with frying pans, saucepans, roasting pans, mixers and popcorn poppers has decreased.
As some consumers refrain from purchasing traditional kitchenware, some sexy newcomers such as espresso machines, electric rice cookers, coffee grinders and electric bread bakers are becoming more popular.
Driven by consumers’ insatiable appetite for saving time and effort, Americans’ use of disposable goods and food storage materials is at an all-time high. NPD reported that of the 2,000 households surveyed, 95 percent contained aluminum foil, 89 percent contained plastic sandwich bags, 87 percent contained clear plastic wrap and 85 percent a~eed to having paper plates.
Furthermore, confirming our increasing desire for convenience, as well as our reliance on frozen food, freezer space is at a premium. Seven out of every 10 households polled had primary freezers that were three-fourths full.
The NPD Kitchen Audit is based on surveys of 2,000 households, 500 each quarter (March, June, September and December 1999), and is conducted every three years. The sample is demographically and geographically balanced to U.S. Census Bureau statistics. Each participating household receives a 16-page questionnaire that asks about the presence or absence of particular appliances, cookware, bakeware, utensils, foods and food ing-redients.
Teens loyal to companies that support causes
According to the 2000 Cone/Roper Cause-Related Teen Survey, when price and quality are equal, 89 percent of teens report they would be likely to switch brands to one associated with a good cause. This support of causerelated shopping represents a 62 percent increase from 1999. Additionally, 85 percent of teens say they would be likely to switch retailers to one associated with a good cause, up 33 percent from last year.
An increasing number of companies are supporting causes to appeal to and stay relevant with the sociallyconscious Generation Y. Teens are responding favorably, accelerating the trend of cause marketing. While 63 percent of teens report they bought a product that supports a good cause in the last year, 80 percent say they are likely to do so in the next year.
From a list of eight purchasing influencers, teens report that after the quality of the product, they consider whether the company makes a donation to a cause (71 percent), and whether the company supports a cause (68 percent) as the second- and third-most important factors when deciding what to buy. A company’s support of causes plays a more important role than price (50 percent), advertising (48 percent), and celebrity endorsement (23 percent).
Eighty-one percent of teens believe companies have a responsibility to support causes. Consistent with 1999 data, teens indicate they reward these companies not only with their purchases, but also with their loyalty and advocacy:
- 91 percent value companies and products that support causes (89 percent in 1999);
- 87 percent will continue to buy products from companies that support causes (85 percent in 1999);
- 86 percent will tell their friends about companies that are committed to causes (80 percent in 1999).
Companies that support causes should communicate their efforts - 95 percent of teens say they want companies to tell them about their cause initiatives. Advertising is the most effective communications vehicle, with teens reporting they learn about companies’ social commitments through ads on television (70 percent), magazines and newspapers (55 percent), and radio (54 percent). Sixty-five percent of teens say they also learn about cause programs in school.
According to the survey, teens are most concerned about school violence (60 percent), drug and alcohol abuse (55 percent), and crime (42 percent) - the same three issues as in 1999. With 69 percent of teens reporting that companies are not doing enough to help the issues they care about, there is a large opportunity for Corporate America to leverage cause marketing to make their brands more relevant to their teen consumers.
For example, as part of its sponsorship of recording star D’Angelo’s summer concert tour, Levi’s partnered with anti-gun violence organization PAX to engage and activate youth to take a stand against the gun violence epidemic. In response to teens’ top concern for safe schools, Chevrolet is sponsoring S.A.V.E. (Students Against Violence Everywhere), a student-run, studentinitiated organization that empowers young people to resolve conflicts peacefully and to become productive contributors in their schools and communities.
A company’s commitment to causes is especially influential on girls’ purchasing behavior:
- Girls are more likely than boys to switch brands to one associated with a good cause (94 percent vs. 83 percent), when price and quality are equal.
- Girls are more likely than boys to switch retailers to one associated with a good cause (91 percent vs. 79 percent), when price and quality are equal.
- Girls are more likely than boys to consider whether the company makes a donation to a cause (77 percent vs. 66 percent), and whether the company supports a cause (74 percent vs. 62 percent) when deciding what to buy.
- Girls are more likely than boys to shop with a cause in mind in the next year (85 percent vs. 75 percent).
Girls are more likely than boys to feel companies are not doing enough to impact social issues (77 percent vs. 62 percent). However, companies that win over girls’ loyalties by supporting causes also gain faithful advocates: girls are more likely than boys to tell their friends about companies that support causes (91 percent vs. 80 percent).
Although 36 percent of teens say they have used the Internet to learn about causes, 61 percent have not leveraged the Internet at all to support social issues. The Internet will play an increasingly important role in empowering teens to make a difference, as many report they plan to use the Internet in the future to learn about causes (71 percent), buy products that support causes (49 percent), and fmd volunteer opportunities (37 percent).
The 2000 Cone/Roper Cause- Related Teen Survey is commissioned by Boston-based consulting firm Cone, Inc. (www.coneinc.com). Roper Starch Worldwide, Inc., conducted this survey between August 3 and August 9, completing 600 online interviews among AOL users ages 12-17. The margin of error is +/- 4 percent.
Organized office or disaster area?
When it comes to their own personal work area, according to Taylor Nelson Sofres Intersearch, Horsham, Pa., 48 percent of Americans work in "Neatville." Another 39 percent say they work in the bordering territory of "Controlled Mess." Of course, there are always those who exist in the outlying regions. Three percent of office-owners are dedicated Neatniks, describing their personal work space as "so neat it’s scary." At the other end of the spectrum are those 9 percent who ride the cluttered trail to disaster. These Chaos Cowboys admit that their office space is "getting out of control" (4 percent), "is just plain messy" (3 percent) or is a "disaster area" (1 percent).
While a combination of files and piles appears in many full-time workers’ offices, it is the proportion of each that creates the boundary line between Neatville and Controlled Mess. When the number of piles sur passes the number of files, it’s a sign that the office owner is working in Controlled Mess or something worse. Those in Neatville most often corral their documents exclusively into fries (65 percent). Few of the Neatnik clan organize through a combination of both files and piles (19 percent pile and file and ! 1 percent pile only). Conversely, 61 percent of the Controlled Mess clan pile in one form or another (31 percent pile and file and 30 percent pile only). Only about a third of the clan (37 percent) primarily use files for storage.
The majority of office owners (60 percent) stay off the path to disaster with routine bouts of culling, herding some documents into the files/piles saving scheme and others into the circular file. Some workers (22 percent) are extremely zealous, throwing out as much as possible. On the other side are the 12 percent who cannot bear to part with anything.
The residents of Neatville generally sort and straighten on a daily basis (78 percent). The Controlled Mess clan takes a more relaxed approach, with less than half (41 percent) doing a daily round-up. As a matter of fact, 13 percent of this clan cleans only when they can’t stand it anymore.
Content drives stickiness of European sites
Many e-commerce Web sites like to boast of low prices and flaunt attention-grabbing graphics, but a new study from Infratest Burke and Burke Interactive suggests that content is king when it comes to making these Web sites "sticky."
The study analysis examined ratings of 36 particular aspects of Web sites along with overall ratings of the stickiness of 25 popular European ecommerce sites. The key finding: The strongest drivers of stickiness include content that encourages site users to explore further, content that is presented in an interesting manner, and content that is relevant to site user needs.
The study takes issue with a common definition of stickiness, which uses only the average time spent at a site as a positive measure. The study, in fact, finds visit duration to be a factor independent of measures that relate to site satisfaction. The stickiness of a Web site is instead here defined as its propensity to get high overall evaluations, high evaluations compared to other Web sites, a high likelihood of being revisited, and a high likelihood of being recommended to others. Responses to four questions relating to these topics were combined into a single stickiness score.
The German music, video, and game site Boxman received the highest stickiness score in the survey, receiving, on average, 17.0 points out of a possible 20.0 from German survey respondents. Among survey respondents in the U.K., the Dell Computer site got the highest average stickiness rating (16.7) among eight British sites included in the survey. The French railway SNCF had the highest average score (15.0) of nine French sites rated by French respondents.
Lowest average stickiness ratings in the three countries were obtained by the German travel site Last Minute (11.5), the U.K. Ticketmaster site (12.3), and the French book, music, and gift site Bol (11.4).
The study was conducted among members of NFO’s European access panels. Panelists who had previously bought a product or searched for information in a category were asked to go to a site being rated, then return to another Web site where they were asked to complete an online survey. In Germany, panelists were asked to rate one site, while in France and the U.K. panelists were asked to rate either one or two sites. A total of 411 respondents in Germany, 321 respondents in the U.K., and 1,561 respondents in France completed the survey.
Although survey results were, in general, similar across the three countries, a few differences did emerge when looking at attributes relating strongly to e-commerce site stickiness. In Germany, the visual appeal of sites did emerge as one of the three key attributes driving Web-site stickiness (in place of relevance of site content). In the U.K., being able to easily find items of interest was one of the top three attributes, replacing content being presented in an interesting manner. The impact of particular attributes was determined by looking at the correlation coefficient between attribute performance ratings and overall stickiness scores.
The attribute that had the weakest relationship with overall site stickiness in both Germany and the U.K. was being able to return products to a retail store. (In the U.K., having a reward points or frequent shopper program had an equally weak relationship with overa!l site stickiness.) In France, the attributes that most weakly related to overall site stickiness were sites greeting users by name and sites offering secure payment.