••• b2b research
B2B firms are active social media marketers
Followers from LinkedIn, engagement from Instagram
 Many industry-defining B2B brands have not only embraced social but have completely changed the game with innovative social strategies, says a TrackMaven report on social media strategy, per a Research Brief re-port. Twelve months of social media content from 316 leading B2B brands across five key social networks – Facebook, Twitter, LinkedIn, Instagram and Pinterest – shows a grand total of 508,060 social media posts and over 100 million social interactions. The 316 brands featured in the analysis include the leading B2B brands in the Global 500 and B2B leaders.
“Overall, B2B brands have the largest audience on LinkedIn – 36 times the median number of followers they have on Instagram. But B2B brands get 20 times more engagement on Instagram than on LinkedIn,” the report notes.
Takeaways in the report from the brands B2B industries excelling on social media include:
Biotech, engineering and financial services brands have both substantial audience growth and high content engagement on social media, indicating impactful social content. The financial services industry’s 81.77 percent average follower growth per brand is especially impressive given the industry’s large median social following.
Brands in the machinery sector see the highest social media audience growth, with average annual follower growth across all five major networks of 129.02 percent. Engaging content is a correlated factor; social media content from machinery brands is ahead of the B2B pack, as indicated by its high engagement.
Across the B2B landscape, biotech brands have the most engaged social media audiences with an average engagement ratio of 12.46. Financial services brands are a distant second at 9.94.
According to the research, LinkedIn is the big B2B winner, based on brand popularity follower count. The median social media audience size for B2B brands is: 109,000 followers on LinkedIn; 34,000 page likes on Face-book; 18,000 followers on Twitter; 3,000 followers on Instagram; 420 followers on Pinterest.
LinkedIn is B2B marketers’ social channel of choice, used by 94 percent of B2B marketers, and the 10 most-liked brands on LinkedIn are all B2B brands, says the report.
Looking at B2B brand popularity by content engagement, the average engagement ratio (number of interactions per post per 1,000 followers) for B2B brands on each social network, Instagram is by far the B2B power-house. The average engagement ratio for B2B brands is: 22.53 on Instagram; 15.88 on Pinterest; 5.99 on Face-book; 1.09 on LinkedIn; and 0.86 on Twitter.
A separate report, The Fortune 500 Instagram Report, and analysis by TrackMaven examining the usage of Instagram including their posting strategies for follower growth and engagement, finds that there are a few major areas of disconnect between how major brands use Instagram and how consumers engage with brands on Instagram.
Fortune 500 companies do most of their posting during East Coast business hours. In fact, Fortune 500 brands dramatically favor the 9 a.m. through 9 p.m. ET timeframe for Instagram posting; 88 percent of Fortune 500 Instagram photos are posted within this 12-hour window. The least-popular time to post among Fortune 500 brands is between midnight and 8 a.m. ET.
Instagram posts by Fortune 500 companies published between 10 p.m. and 3 a.m. ET time see the highest average engagement level, compared to the average engagement for Fortune 500 Instagram posts, says the re-port. Posts published in this window see 6.15 percent to 8.78 percent more engagement than the average Instagram post from a Fortune 500 brand. The worst time to post on Instagram for Fortune 500 brands is between 11 a.m. and 4 p.m. ET. Posts published within this window see 4.18 percent to 6.58 percent less engagement than average.
Videos are a different story, says the report. The video functionality is relatively new on Instagram and, as a result, the data set is small. But the report reveals that consumers are more likely to interact with Instagram videos during non-work hours.
Fortune 500 brands post their videos primarily during work hours, just like their pictures. During work hours, an average of 22.5 out of every 1,000 Instagram followers interacted with videos posted by Fortune 500 companies. During off-hours, 33.4 out of every 1,000 followers interacted with the content, which is nearly 50 percent higher. And finally, on the weekends, followers interacted with videos at a rate of 25.7. The report suggest that some consumers are probably reluctant to watch videos, which may include an audio component, while they are at work.
••• lifestyle research
What does the modern family dinner look like?
No phones but TV OK
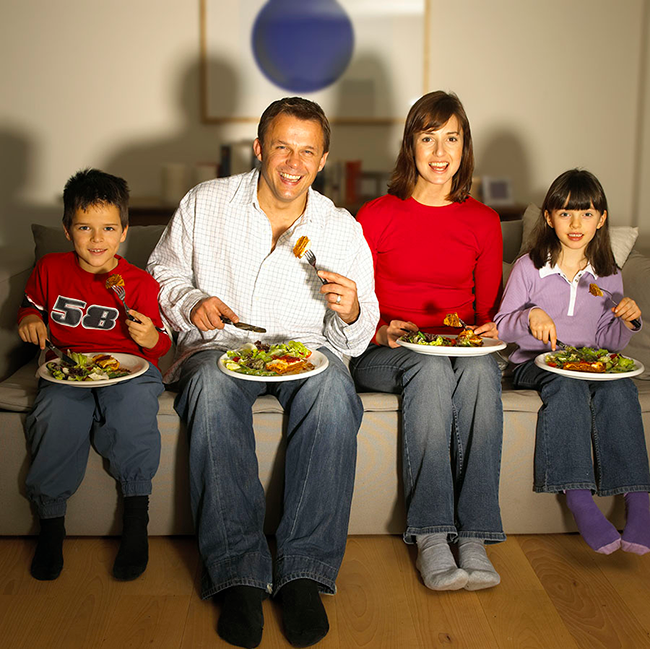 Family dinners have customarily held a sacred place as part of family life, holidays and traditions. But what do they look like to Americans today? To better understand what modern “family dinners” mean, The Harris Poll found out who’s invited, how often the table is set and what role technology plays at the table.
A majority of adults who live with others sit down to family dinners at least once a week and 93 percent of Americans say family dinners are something to look forward to. But be careful about what you bring to the table – 90 percent of Americans say cell phones don’t belong. Other technology, however, is welcome, with nearly four in 10 eating their family meals in front of the TV (37 percent). These are some of the results of The Harris Poll of 2,236 U.S. adults surveyed online between March 16 and 21, 2016.
Among those who live with others, a vast majority (87 percent) sit down to family dinner at least once a week, while just 5 percent say they never have family dinners. Those most likely to sit down once a week tend to have incomes of $75,000 or more. Married Americans are more likely than those who aren’t to sit down every night (34 percent vs. 21 percent). For many, just getting dinner on the table can turn into a family affair, with 65 percent saying it’s a group effort, especially among adults with kids under 18 in the house (71 percent vs. 61 percent of those without).
But is it enough? Those who don’t sit down more often say it’s because it is too difficult to coordinate schedules (29 percent) – a reason cited more often by unmarried Americans (36 percent), compared to their wedded counterparts (24 percent). Those excuses may be regretted in the future, however, as over 4 in 10 Americans (44 percent) say they wish they’d had more family dinners when they were growing up – a sentiment especially strong among adults with kids in the house (53 percent vs. 39 percent without). On the other hand, four in 10 (42 per-cent) are perfectly content with family dinner frequency, saying they sit down together as often as they would like.
The proverbial dining room may be losing its appeal. Although a majority of Americans (71 percent) say they eat around a table, 37 percent eat in front of a television and 22 percent eat on the couch. Kids definitely make a difference, however, as adults with kids in the house are more likely to eat at the table (76 percent) compared to those without (68 percent). On the other hand, adults without kids in the house are more apt to eat in front of the TV (44 percent vs. 27 percent with kids), as are unmarried adults (42 percent vs. 33 percent married).
Most commonly, spouses (65 percent) and immediate family (58 percent) are present for family dinners. Two in 10 (20 percent) say their parents attend and around one in 10 (11 percent) say extended family or friends join in as well. Millennials are much more likely to have friends, parents, extended family and roommates attend family dinners, compared to their older counterparts.
No matter who may be in attendance, many are just happy to have their family together. With all of the recent emphasis on healthy eating, local sourcing, and organic foods, it may be refreshing to hear that over eight in 10 (86 percent) say the family eating together is more important than where the food comes from. At the same time, however, 79 percent say they have made changes to make their family dinners healthier over the past couple of years.
This Harris Poll was conducted online, in English, within the United States between March 16 and 21, 2016 among 2,236 adults. Figures for age, sex, race/ethnicity, education, region and household income were weighted where necessary to bring them into line with their actual proportions in the population. Propensity score weighting was also used to adjust for respondents’ propensity to be online. Respondents for this survey were selected from among those who have agreed to participate in Harris Poll surveys. The data have been weighted to reflect the composition of the adult population. Because the sample is based on those who agreed to participate in the panel, no estimates of theoretical sampling error can be calculated.
••• health care research
Patients, HCPs differ on health care knowledge levels
They don’t know what they don’t know
 While patients are most confident that they have both the knowledge (81 percent) and tools (74 percent) to manage their own health effectively, only half as many health care professionals (HCPs) think patients have the knowledge (41 percent) and tools (49 percent) to do so. Similarly, half of HCPs said they have patients who think they know a lot about healthy living but actually do not. This indicates that there is gap between what is considered appropriate management of an individual’s health and what professionals deem is necessary to ensure appropriate care.
These findings come from a new report, the Future Health Index (FHI), an international study from Nether-lands-based health technology company Royal Philips which explores how 13 countries around the world are positioned to meet long-term global health challenges through integration and connected-care technologies.
The U.S. ranks highest on health care access and high on connected-care technology adoption but lower than average on health care integration, according to the report. While health care system integration is recognized as important and beneficial in the U.S., it is still in its early stages. Additionally, although interest in connected-care technology is high, the U.S. is not yet taking advantage of these devices to power integrated health care, signaling potential areas of opportunity for the American health care system.
While both patients and HCPs surveyed in the FHI agree that access to care in the U.S. is good, there are some wide contradictions in place when it comes to personal health management. For instance: 88 percent of Americans would rather be healthy than rich, yet only 37 percent anticipate that their health will be very good or excellent in the next 10 years. Four out of five Americans over the age of 50 suffer from one or more chronic conditions.
Only 13 percent of HCPs predict that our health would be very good or excellent in 10 years. Moreover, health care professionals do not believe that Americans know how to manage their health effectively; both patients (81 percent) and health care professionals (78 percent) agree individuals have full responsibility for preventing poor health.
Additionally, the top reasons Americans have not visited a health care professional include: the cost of care; denial that they need to see a doctor; lack of time to go and difficultly getting an appointment.
When it comes to new consumer technologies aimed at improving certain aspects of an individual’s health, the FHI found that Americans believe connected care technology, such as wearable devices, is helpful: 79 per-cent of connected-care device owners believe the device has allowed them to take better control of their health; most Americans only use them for a short period of time and 63 percent of device owners have not shared the data from the device with a HCP.
More than three-quarters (76 percent) of device users – who were currently not using their devices – had only used their wearable to track physical activity for six months or less.
When asked why they stopped using the device, more than half (54 percent) said they just “lost interest in using” the device.
These findings indicate that even if relevant health data is being collected, it is not being examined by a professional who could potentially deliver recommendations and discuss observations that could positively impact an individual’s health – further validating that today’s connected devices need to move beyond lifestyle products and support collaboration and better health management.
To improve the quality, access and affordability of care, health care systems around the world are transforming from a focus on hospital-based reactive care to new models of integrated, coordinated care from healthy living and prevention to diagnosis, treatment and home care. To further explore how this will impact the future of U.S. health care, Philips partnered with the Institute for the Future (IFTF) to examine the market perceptions that are impacting the FHI findings, as well as the future forces that will impact what the future of U.S. health might look like in 2026.
According to IFTF, health care cannot keep pace with illness as people age. Despite medical advances that have boosted life expectancy, over the next decade, health care leaders and decision makers must redefine access, integration and technology adoption, moving decision-making to the patient and family.
In order to move from reactive to preventative care, individuals will be expected to be true partners in managing their own health. The ultimate goal must be to design a health care system and engage patients in ways that help to ensure their health span matches to their life spans.
IFTF also highlights three key forces that will inform and influence patient and provider views on access, integration and technology adoption over the next decade. They include:
Flipped care. Access to health care will change from provider-centered to person-centered where encounters between patients and the health care system will occur virtually and in new consumer-directed settings. Demonstrating the need for integration and connected-care outlined in the FHI findings.
Integrative health systems. A system of health that will include the external factors well beyond the walls of the clinic or hospital – housing, family support, food, wealth and education. The FHI report highlights that integration is still in its infancy in the U.S.
Encoded intuition. A shift in technology from assistive to empowering devices that will rely heavily on the patient’s willingness to take a proactive role in managing their health reinforces the FHI finding that connected care devices could play an empowering role in improving self-management of health.
In fact, according to IFTF, HCPs thought an automated tracking program would be as effective a tool as better access to health facilities for patients and more effective than more personalized consultations and treatments from their health care providers. The IFTF also outlines that the next wave of wearables will be designed as temporary tools to help reprogram lifestyles and behaviors in order to improve overall health and well-being. Ultimately, the goal of a health app or fitness wearables will be to make themselves redundant, helping people to make better health choices until they are no longer dependent on the device, not to build dependency on another technology.
••• online research
Profile of the online shopper
Shopping from the bathroom?
 According to a new study examining the online shopping and purchase habits of the U.S. population, results show that 96 percent of Americans are shopping online, spending an average of five hours per week making online purchases and allocating an average of 36 percent of their shopping budgets to e-commerce. U.S. shoppers ranked online shopping ahead of smartphone GPS and streaming media as a basic essential they could not live without, according to the report from Austin, Texas-based e-commerce platform BigCommerce.
The study was conducted to determine how U.S. shoppers buy online and to help inform and educate the broader industry on running an effective online business in today’s retail environment. Its results suggest that consumers are buying wherever, whenever and however is most convenient to their lifestyle and Web browsing habits.
“Shoppers are dedicating more of their time and budget to online shopping and the frequency and number of online stores they purchase from has grown exponentially during the past few years,” says Troy Cox, senior product director at BigCommerce. “With e-commerce now such a prevalent part of America’s buying habits, retailers have an incredible opportunity to reach more customers by opening their business to new channels.”
While e-commerce favors younger generations, with Millennials spending nearly half of their total budget online, all Americans are allocating a significant amount of their time and budget to online shopping: 67 percent of Millennials and 56 percent of Gen X prefer to search and purchase on e-commerce sites rather than in-store; 41 percent of Baby Boomers and 28 percent of seniors prefer online to offline shopping. Millennials and Gen X spend 50 percent more time shopping online each week (six hours) than their older counterparts (four hours).
Although they have greater proximity to physical stores, online shoppers in metropolitan areas spend more online annually ($853) than suburban shoppers ($768) or those in rural areas ($684).
Men reported spending 28 percent more online than women during the past year.
Online spending is taking up larger portions of the American household budget, with shoppers going to marketplaces, online stores, major brands and specialty retailers to find the perfect product; 80 percent make online purchases at least once a month; 30 percent make a purchase at least once a week.
Nearly half (48 percent) of online shoppers have bought or spent more than planned when shopping online.
One in two (48 percent) online customer journeys begin at e-commerce marketplaces such as eBay or Amazon.
In the last year, online shoppers have spent the most with e-commerce marketplaces ($488), closely followed by major online/offline brands ($409) such as Nordstrom or Best Buy.
With notifications the new normal and devices always on-hand, there is no limit to where and when people shop online: 43 percent of online shoppers have made a purchase while in bed; 23 percent have made an online purchase at the office, while 20 percent have purchased from the bathroom or while in the car; a quarter of online shoppers (25 percent) have made an online purchase while at a brick-and-mortar store. One in 10 shoppers admitted to buying something online after drinking alcohol.
Today’s online shopper is driven by price, shipping and a personal connection to the product. When identifying factors influential in determining where to shop online, 87 percent of respondents cited price as influential, closely followed by 80 percent reporting shipping cost and speed as influential.
Sixty-six percent have decided not to buy an item because of shipping costs; 72 percent of females and 59 percent of males have decided to abandon their purchase because of shipping costs.
Online shoppers want products to be brought to life with images (78 percent) and product reviews (69 per-cent). Half of respondents cite not being able to touch, feel or try a product (49 percent) as one of their least favorite aspects of online shopping; 34 percent said difficult to return items and waiting for delivery were also a pain.
Consumers are more open than ever to buying via social posts and pins, with 30 percent of online purchasers stating that they would make a purchase from a social media network. Respondents were most open to making a purchase on Facebook (20 percent), closely followed by Pinterest (17 percent), Instagram (14 percent), Twitter (12 percent) and Snapchat (10 percent).
Males are more open (23 percent) than women (17 percent) to make a purchase through Facebook. More than half (51 percent) of Millennials say they would be likely to buy through a social network.
BigCommerce conducted this survey in partnership with researcher Kelton Global during March 15-19, 2016. Survey responses were collected from more than 1,000 nationally representative Americans 18 years and older who cited making an online purchase within the previous six months. To view the full report on the country’s shopping habits, visit www.bigcommerce.com/blog/omni-channel-retail.
••• alcoholic beverages
They like mojitos at Fridays
Study taps U.S. drinking trends
 A snapshot of America’s eating and drinking habits in restaurants and bars emerges from the first On-Premise Consumer Survey for the U.S. market from Nielsen CGA, a joint venture between Nielsen and CGA Strategy. A biannual survey of 15,000 on-premise consumers, all of legal drinking age, it aims to provide a look into America’s preferences and is nationally representative of age, gender and location (state).
Here are some sample findings.
General fan favorites: 23 percent of the U.S. population have drunk a cocktail out of home in the last three months. Tequila (44 percent) is the favorite liquor base for cocktails in the U.S., followed by: light rum (39 per-cent), flavored vodka (39 percent), non-flavored vodka (39 percent) and whiskey (27 percent). The margarita (60 percent) is the most popular cocktail in the U.S., followed by: daiquiri (44 percent), piña colada (36 percent), Long Island (33 percent) and mojito (29 percent). Forty-eight percent of consumers feel that cocktail menus with named liquor brands are very important or important when choosing a cocktail.
Fan favorites by retail chain: Chili’s consumers are 7 percent more likely to try a margarita (67 percent) than the U.S. average (60 percent). Buffalo Wild Wings consumers are 7 percent more likely to try a tequila sunrise (34 percent) than the U.S. average (27 percent). Bonefish Grill consumers are 13 percent more likely to try a martini (39 percent) than the U.S. average (26 percent). TGI Fridays consumers are 8 percent more likely to try a mojito (41 percent) than the U.S. average (33 percent).
How much are Americans willing to pay for a cocktail when out? $8.72 for a standard cocktail. Consumers are willing to pay 25 percent more for a cocktail made with premium spirits. The average willingness to spend: $10.98.
A hunch about brunch: Around six in 10 Americans are likely to drink alcohol with brunch; 24 percent of those who eat out at brunch will drink a cocktail. Forty-five percent of brunchers would often order mimosa, 36 percent a bloody Mary and 27 percent a Champagne cocktail.
The Nielsen CGA on-premise consumer survey was conducted online, in English, within the U.S. between March 20 and April 7, 2016, among 15,000 adults (aged 21 and over) who have visited an on premise establishment at least once in the last three months during the time of the survey.