

••• technology research
The AI tax
Consumers are penalizing brands for too much automation
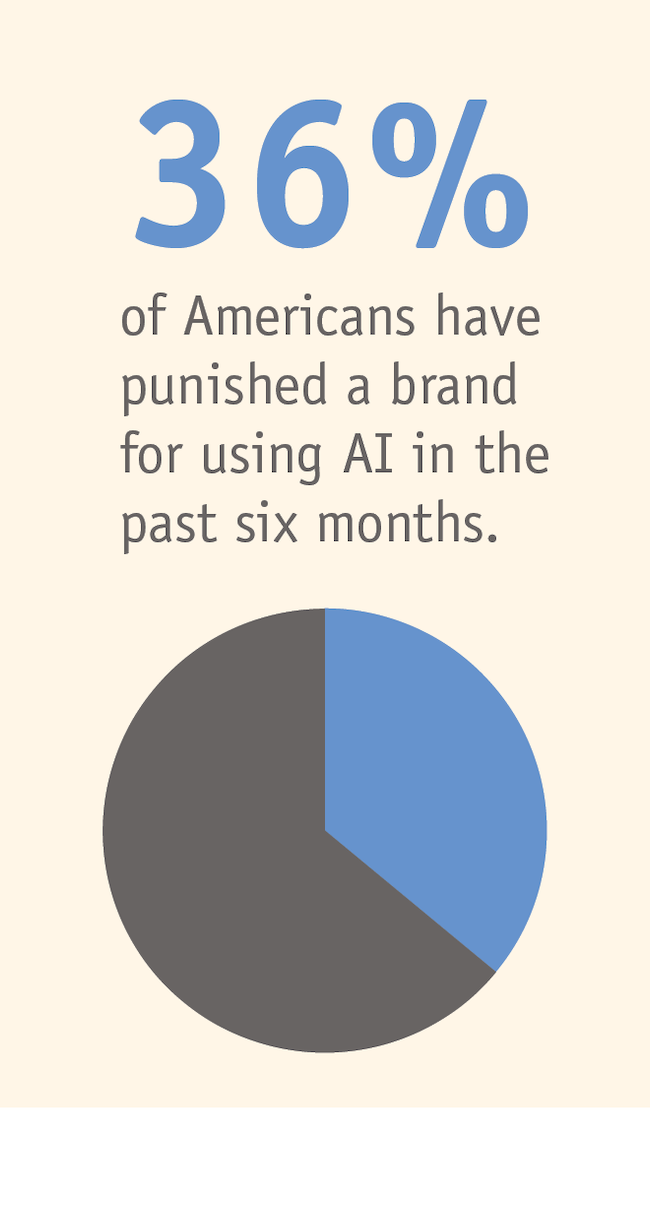
As AI develops and grows in popularity, consumers are making their voices heard. A survey of 1,017 U.S. adults released by market research platform SegmentOS found that 36% report taking concrete action against a brand in the past six months specifically because it felt too AI-driven. This action involves unsubscribing, canceling, switching to a competitor or simply leaving negative reviews.
This phenomenon has been named the “AI tax” by SegmentOS and is simply defined as a measurable penalty that consumers impose on companies for visible AI use, paid in lost sales and eroded trust. Brands often miss this gap because customers rarely explain why they left.
While it’s commonly believed amongst businesses that valuable consumers have higher barriers to abandon reliable companies, the evidence shows that AI backlash is strongest among the most valuable customers. Those earning $120,000 or more were most likely to say they would pay a premium for human-made products (68%) and most likely to abandon a purchase rather than deal with an AI chatbot (57%).
Beyond income, there are also generational patterns associated with the discomfort in AI: 59% of consumers aged 18-28 have penalized a brand for using AI, versus just 18% of those 61 and older.
These penalties are more than just behavioral. Among those who could estimate, 47% said they have withheld some spending from brands over their AI use in the past year, with 9% saying they’ve withheld more than $250. This is money that the companies will never see because customers don’t file a complaint or give a reason.
Of two identical products at the exact same price, about two-thirds of respondents (68%) chose the one labeled “made by humans” as opposed to only one-in-10 who chose “made with AI.” Over half (54%) said they would pay more for human-made.
Once a consumer realizes a brand’s copy was AI-written, 47% say their trust drops immediately. Twenty-three percent report catching a brand “AI-washing,” or passing AI-generated work off as human.
Almost half (45%) have abandoned a purchase or support request because they were stuck with an AI chatbot instead of a human. This is the single most-cited AI grievance in the study.
There are some no-go zones when it comes to AI, specifically high-stakes domains. For medical advice (67%), therapy and mental health (61%) and legal advice (59%), a guaranteed human is important to consumers.
Findings are based on an online survey of 1,017 U.S. adults conducted in June 2026 via the SegmentOS verified consumer panel. Respondents passed an in-survey attention check. Results are statistically weighted by age and gender to match U.S. Census adult population estimates (2025).
••• transportation research
The road to robotaxi trust
Safety concerns are slowing consumer adoption
As robotaxis arrive in more and more cities, Americans are unsure if they want to hop in. According to the TaskUs 2026 AV Trust Consumer Survey, the top two consumer sentiments surrounding robotaxis are curiosity (42%) and nervousness (41%). The same number of respondents (41%) have never had the opportunity to ride in a robotaxi before.
Besides curiosity and nervousness, one-third of respondents are skeptical, one-fourth excited (26%) and fearful (25%), with only 11% feeling indifferent about robotaxis.
In cities offering robotaxis, 35% of consumers are very likely to try them within the next year compared to 10% of consumers who don’t live in those cities. Almost four-in-10 (37%) consumers who live in those cities have ridden in one, compared to only 6% of those who don’t live in a robotaxi market. Twenty-five percent were not familiar with autonomous vehicles at all.
In terms of safety, over one-third (35%) believe that robotaxis are safer than human drivers and almost three-in-10 (27%) believe that robotaxis are just as safe as taxis driven by humans. Still, 38% believe robotaxis are still less safe than humans behind the wheel.
Consumers are less concerned with everyday driving situations and more by worst-case scenarios in robotaxis. For example, 43% are most concerned with a fear of accidents or system failure, followed by a lack of control (22%), uncertainty with the technology (13%) and a lack of human interaction (11%). Only seven percent of consumers are completely at ease, reporting no safety concerns at all.
Of those who are concerned with safety, 48% of consumers fear robotaxis will misinterpret road conditions, 47% fear robotaxis won’t react as well as humans and 47% worry the robotaxis will break down in emergencies.
Younger generations tend to trust the newer technology more. Almost one-in-three (29%) of Gen Z consumers would fully trust a robotaxi in an unexpected situation, followed by 28% of Millennials, 24% of Gen X and only 11% of Baby Boomers.
The lack of trust goes beyond just the technology. Human operators behind the robotaxis can intervene and help passengers at any point. However, only 17% of consumers are “very confident” in operators’ ability to intervene in an emergency, 30% are “somewhat confident” and 26% are doubtful.
There are various ways through which trust can be built in consumers: 29% of respondents feel increased government regulation and oversight would help; 27% cite positive reviews from other passengers; 27% say clear communication from the vehicle and 26% feel regular performance updates would help soothe fears. When asked which factors could help improve adoption, 41% of consumers cited human oversight as being extremely important.
••• shopper insights
Buyers aren’t ready to hand over control
Trust drops when AI agents act independently
While consumers are turning to AI as a shopping aid, a YouGov survey of more than 2,000 U.K. adults found that only 19% trust AI assistants to follow rules to make everyday purchasing decisions, compared to 55% who trust a human advisor. Almost seven-in-10 (69%) do not trust AI, even when it follows rules they set, while 60% say they would stop using an AI agent after just one mistake.
This doesn’t count AI out for all aspects of shopping, however. Half of respondents trust AI to find the best price available, with 43% trusting it to follow spending limits. Only 18% trust AI to act in their best financial interest; just 17% trust it to keep personal and payment data secure and only 15% trust AI to handle problems when things go awry.
Forty-four percent of respondents say they would not trust an AI shopping agent regardless of savings and 25% say it would need to save them more than 15% before they would trust it.
When AI agents act independently or have access to sensitive financial data, concerns increase. Seventy percent say purchases made without asking would impact their willingness to use an AI shopping agent; 61% say linking it to a bank account and 54% say tracking everything they browse online would affect their willingness to use an AI agent.
In terms of responsibility, 54% say the technology or AI company that built the agent should be accountable for refunds. Only 9% blame the retailer with a mere 3% blaming banks or card issuers.
About six-in-10 consumers (59%) say they would not trust any organization to manage AI-powered shopping and payments. Even banks and other regulated financial payment providers are chosen by just 20%, while technology companies and retailers are chosen by only 4% each.
All figures, unless otherwise stated, are from YouGov Plc. Total sample size: 2,080 U.K. adults (18+). Fieldwork conducted between June 19-22, 2026. The survey was carried out online and weighted to be representative of the U.K. adult population.
••• sports research
Fans are fed up with fees
High costs dampen the live event experience
This past summer’s FIFA World Cup in North America made 57% of fans surveyed more interested in attending other live sporting events beyond soccer matches. But that enthusiasm was tempered by a list of annoyances.
For its 2026 Fan Experience Study, Alchemer surveyed over 1,000 U.S. fans who attended a professional or college sporting event in the past year about their experiences. Almost half (48.4%) feel that ticket prices are a barrier to attending more live events. Parking, concession or other on-site costs (17.4%), inconvenient venues (13.5%) and comfort (9.8%) are the next most popular barriers. In all, 66% of fans point at financial reasons as a reason not to attend live events. About one-third (32.3%) of fans feel they are constantly nickel-and-dimed with extra fees and 42% feel they are somewhat nickel-and-dimed. About 74% feel venues will engage in surge pricing and upselling, drowning them in add-on fees.
One of the best-scoring aspects of gameday is the venue employees. Seventy percent of fans describe the staff they met as friendly and helpful, 59% call them knowledgeable and only 5% found them unhelpful or dismissive.
Music and atmosphere added to the overall experience for 52% of fans, and about 36% found them fine but unmemorable. One-third of fans consider a promotion, giveaway or loyalty activity a highlight of a visit. Almost one-fourth (23%) took part without finding it engaging, 22% never knew the opportunity existed and 22% knew but passed on participating.
Stadium technology is evaluated by the problem it solves and the cost of a failure. Digital ticketing (30%) and mobile ordering (27%) are the only tools a sizable share of fans credit with improving their visit. The overall experience is impacted by a stadium or team app, with 70% of fans saying the app worked well or had only minor glitches, but only 12% saying it improved their experience.
Only 8% of fans found an AI chat assistant to be helpful, with 24% saying they’d rather see it go. This being said, 55% of fans would trust AI to answer a stadium question and 45% would take a seat recommendation.
Less than half (45%) of respondents have given feedback to a venue or team after an event. Almost one-in-five (19%) were asked and didn’t respond, and 36% don’t recall ever being asked through any channel. Of those who were asked, 70% responded. For 32% of fans, they prefer to be asked for feedback a few days later, followed by same-day outreach (31%) and a real-time prompt during the event (15%).
Alchemer surveyed 1,064 U.S. fans who attended a professional or college sporting event in the past 12 months.
••• travel research
Fun for all ages and abilities
Families are paying more for accessible trips
Multigenerational travelers are ready to spend more to ensure that the whole family can enjoy the trip, but finding accommodations that meet everyone’s needs remains a challenge, according to a survey by travel company Fora.
The survey of over 2,500 consumers examined accessibility needs, spending and travel booking behaviors and found that while demand is significant and growing, the travel industry has been slow to capitalize on the opportunity.
More than half (55%) of families planning a multigenerational trip say someone in their group requires some accommodations. Almost eight-in-10 (78%) say they would pay more to make sure these needs are met.
Two-thirds of travel advisors surveyed have booked a trip for a client with an accessibility need. Of those advisors, 34% say these trips now make up more than 10% of their bookings and 18% say it’s more than a quarter of their business. Almost half (48%) say demand for multigenerational trips with accessibility needs has grown compared to last year.
Most (62%) consumers have taken a multigenerational trip, with 30% taking one every few years. This number is trending up, with 35% planning or considering a multigenerational trip in the next three years, rising to 52% among households earning $150,000 or more a year.
Consumers who say their families have accessibility needs for a multigenerational trip they’re planning or considering report a wide range of issues, with the most common being limited walking endurance or stamina (48%), food allergies or dietary needs (37%), and medical equipment or medication (36%). Among these, 68% have multiple accessibility needs in their group. Mobility or wheelchair access ranks fifth on this list, behind where advisors might expect it. Although wheelchair access may be less common than other needs, it demands more planning expertise when it does come up.
Advisors say that while older travelers are often part of accessible trips, they don’t dominate them: 55% of advisors say less than half of their accessible bookings involve a traveler 65 or older.
Consumers say that family members of all ages need accommodations. Sixty-four percent of respondents saying they need accommodations for a potential trip are adults aged 65 or older. More than one-in-three (36%) say a parent or another adult (ages 18 to 64) in their group would need an accommodation and almost one-in-four (23%) say a child or teenager would.
U.S. travelers with disabilities spend nearly $50 billion a year on travel and more than $100 billion once their companions are included, according to a 2024 Open Doors Organization and Harris Poll study. The data shows that not only are these travelers willing to spend, they're willing to spend more.
More than four-in-10 (42%) of those who have taken or are planning or considering a multigenerational trip say they’d be willing to pay more per person for a multigenerational trip compared to a typical vacation. Add someone who needs an accommodation and the figure jumps: Among those planning or considering a multigenerational trip (for which they will need at least one accommodation) within the next three years, 78% would pay more for a trip that properly meets everyone’s needs.
Sixty percent of consumers planning or considering a multigenerational trip and requiring an accommodation say they feel excited about creating shared memories. But almost a third (31%) feel stressed about whether a hotel or other lodging will actually meet their group’s needs and nearly as many (29%) are anxious about finding accurate information beforehand.
Advisors frequently book high-value accessible trips: 52% have booked a cruise for a client with accessibility needs and 48% have booked a luxury hotel for a client with accessibility needs.
No matter what the accommodation, these are not low-cost trips: 44% say their largest accessible booking in the last 12 months topped $10,000 – several times the average booking value. And 78% say accessible trips generate the same or higher spend than the average trip.
Booking these trips drives loyalty. Fifty-five percent of advisors say clients with accessibility needs are more likely than their average clients to become repeat clients. Travelers also find working with an advisor helpful for these high-touch trips. Among consumers with an accessibility need in their group for an upcoming trip who have previously worked with a travel advisor, 90% say they’d use that advisor again, nearly matching the 93% rate for multigenerational trips and well above the 68% rate for other kinds of trips.
A bigger budget doesn’t make an accessible room easier to find. Among advisors who work with luxury clients, 41% say it’s difficult to source luxury options that also meet accessibility needs.
The problem doesn’t ease with experience. Among advisors whose accessibility bookings make up 10% or less of their business, 43% say it’s difficult to find accommodations that truly meet a client’s needs. Among advisors for whom those bookings make up more than half of their business, that number jumps to 73%.
Nearly half of advisors (47%) say the industry’s accessibility efforts have improved over the past two years. Hotels get the most credit: 40% of advisors name hotels as the segment that’s improved the most, followed by cruise lines at 25%.
Fora commissioned YouGov to poll 2,592 Americans 18 or older. The survey was carried out online July 24-28, 2026. The results have been weighted to be representative of all U.S. adults. Fora surveyed 1,359 Fora advisors at the Certified level or above (Certified, Advanced, Pro and Fora X). Respondents below Certified were excluded from all results in this report. The advisors survey ran online from August 5-17, 2026.