Editor's note: Terry Grapentine is principal of Grapentine Company LLC, an Ankeny, Iowa, research firm. He can be reached at tgrapentine@gmail.com. The author wishes to thank the following, who offered constructive comments on earlier drafts of the article: Aldy Keene, the Loyalty Research Center; Larry Constantineau, David Dwight, Cummins Inc.; David Soorholtz, Market Sense Inc.; and Kevin Gray, Cannon Gray LLC.
In 1984, Kano, et al. (hereafter referred to as “Kano”) published a model purporting to help management design products that better satisfy customers.1 The model involves having consumers evaluate a battery of product attributes – called quality elements – on two different questions. Based on their answers, the model classifies the quality elements into different evaluation categories – and it is these categories that purportedly provide product design guidance to managers.

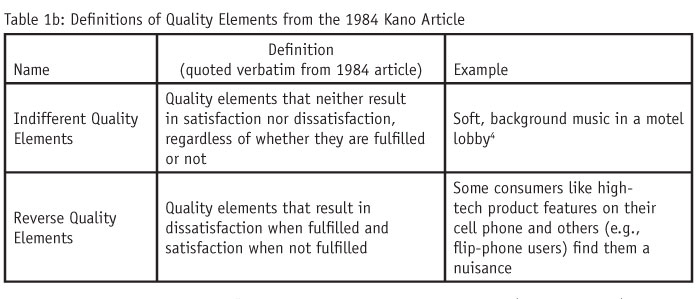
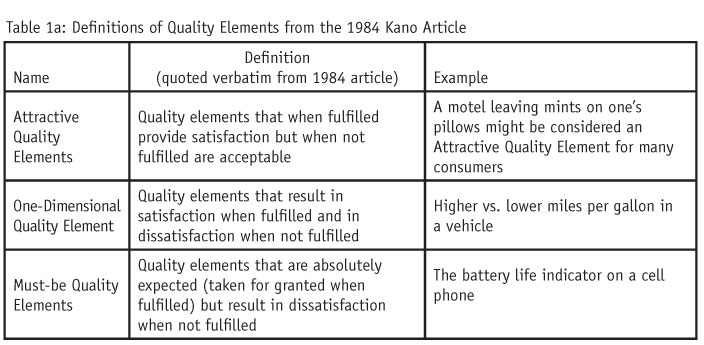
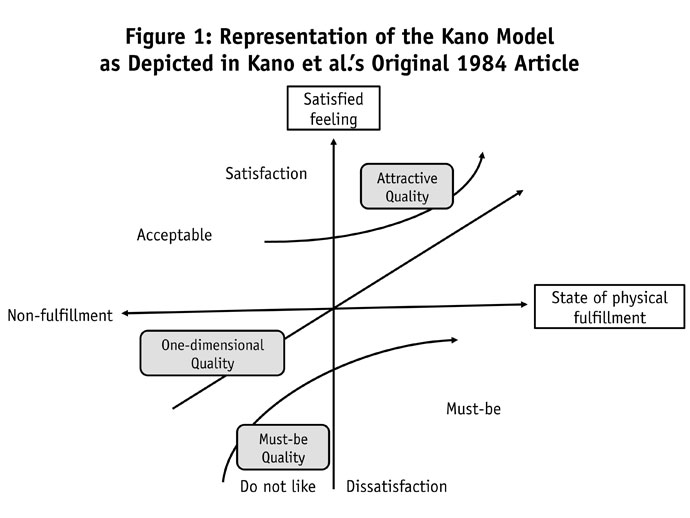
Figure 1 is Kano’s framework as it appears in the 1984 paper. Quality elements fall along two dimensions. The vertical dimension ranges from (top) a more “satisfied feeling” to (bottom) “dissatisfaction.” The horizontal dimension ranges from (left) “non-fulfillment” to (right) “state of physical fulfillment.” “Fulfillment” is described in the literature as “attribute performance,”2 ranging from (left) worse to (right) better; or “objective quality,”1 which is the “amount of the quality element”3 that is present in the product, e.g., no cupholders (quality element not present) to many cupholders (quality element present to some degree). Based on these ratings, Kano groups these elements into three categories as defined in Table 1a and shown in Figure 1. (Kano discusses two additional categories, “indifferent” and “reverse quality elements” [Table 1b], which were not depicted in Figure 1.)
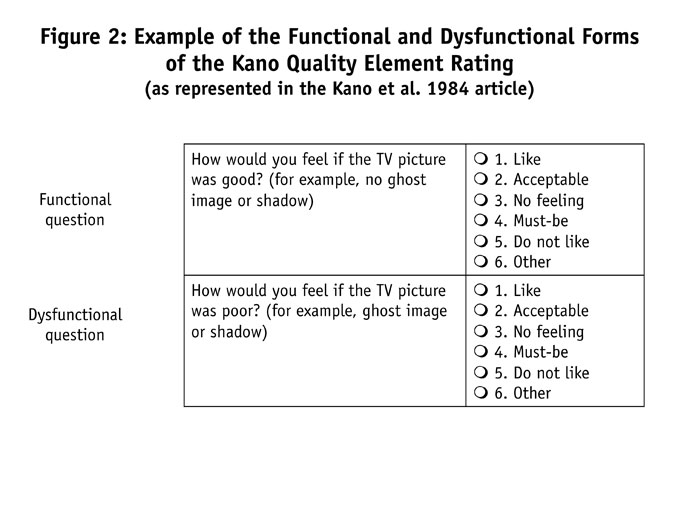
Respondents rate quality elements on two questions (see Figure 2). The literature refers to the first question as the functional question – the quality element is present. The second question is the dysfunctional question – the quality element is not present or present to a lesser degree than in the functional form.
Interpreting the Kano model
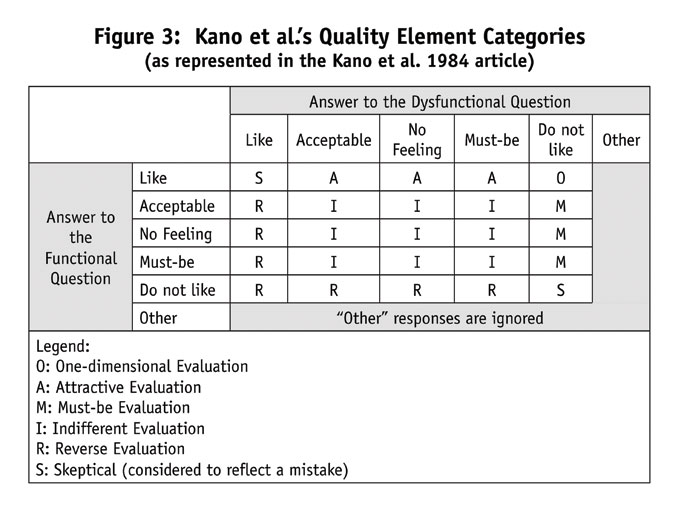
Figure 3 shows how these quality element ratings are classified into Kano’s six evaluation categories. Kano emphasizes the first three (examples drawn from Amy M. Gregory’s dissertation2):
- Optimize product performance. Seek to provide the highest performance as technology and the market allow for one-dimensional quality elements. For example, for the functional question, most people would rate relatively high gas mileage, “like.” In the dysfunctional question, most people would rate relatively low gas mileage, “do not like,” which places this quality element in the one-dimensional category.
- Product differentiation. Endeavor to distinguish your product on the “attractive” dimension. For example, for the functional question, most people would rate getting extra blankets/pillows in a hotel room, “like.” For the dysfunctional question, most would rate the absence of these extra items, “acceptable,” which places this quality element into the “attractive” category.
- Meet consumers’ basic needs. Insure the product delivers quality elements in the “must-be” category. For example, for the functional question, most people would rate the presence of a color TV in a hotel room “must-be.” For the dysfunctional question, most people would rate the absence of a color TV in a hotel room “do not like.” Kano translates these ratings as falling into the “must-be” category.
Kano model problems
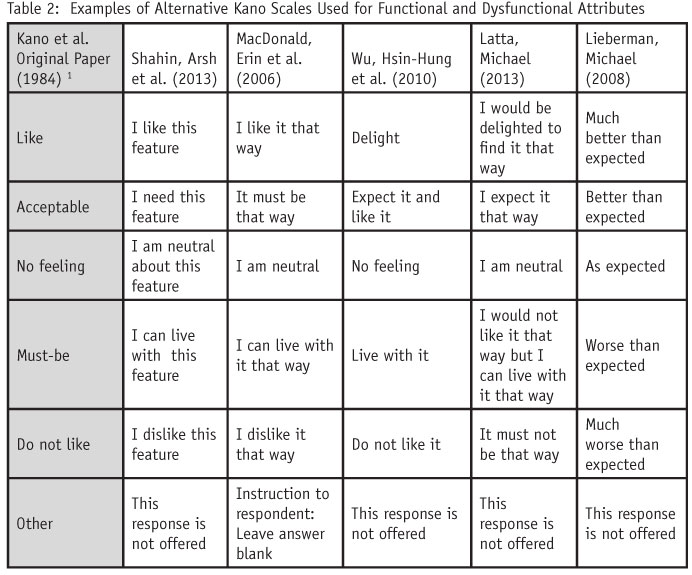
Kano scale disagreement. Table 2 shows that many authors have changed the wording of the Kano scale. So, do different scale definitions give the same results? MacDonald et al.,5 (hereafter referred to as “MacDonald”) say no. In testing several ways of presenting and labeling the scale points, the authors state that “We found that survey scale [definition] does make a difference in how respondents answer the survey [and the number of times a respondent uses a particular scale point in its functional and dysfunctional format] ... varies significantly across the four versions of multiple-choice answer frameworks [tested in our study].” For example, when comparing MacDonald’s definition of the Kano scale points to simply anchoring the scale endpoints from “like” to “dislike,” they found that the frequency with which respondents used the mid-point of the scale differed between the two approaches.
Kano classification vs. self-classification. MacDonald gave respondents definitions of the Kano quality element categories and then had respondents classify the quality elements directly into the Kano categories (e.g., one-dimensional evaluation, attractive evaluation, and so on). They concluded that “… the Kano method does not classify attributes as individuals would classify them in direct categorization.”
Although MacDonald claims to offer methods to overcome these shortcomings, my review of the literature suggests that there is no generally accepted approach as to the most valid way to define the Kano scale. Shahin, et al. corroborate my belief in their 2013 review of the Kano literature when they say that “It is apparent from the literature that there is no unique type of Kano model and Kano evaluation table.”
Problematic response patterns. Conceptual definition vagueness and ambiguity within the functional and dysfunctional form questions can cause the Kano model to produce illogical respondent response patterns and Kano recognized this to a degree. For example, Kano identifies three awkward answer patterns to the Kano scale (see Figure 3) labeled either “S” (skeptical) or “other.” This occurs when respondents answer “like” to both the functional and dysfunctional questions (category S); answer “do not like” to both formats (also category S); or, if the “other” option is provided, respondents select that response for either or both question formats.
Additionally, it’s difficult to reconcile Kano’s quality element classifications (Kano’s terminology) in Table 1a and 1b and the quality element evaluation categories (Kano’s terminology) in Figure 3. For example, Kano says that “must-be” elements “are absolutely expected …” and when absent, “result in dissatisfaction” (Table 1a). But he also labels as being in the “must-be” evaluation category (Figure 3) a situation in which a respondent selects “no feeling” if a quality element is present (the functional question) and then selects “do not like” if the quality element is not present (the dysfunctional question). That pair of answers is nonsensical – if you truly have no feeling for if a quality element is present, why would you respond “do not like” if the quality element is not present?
The problem in this example reveals incoherence between Kano’s quality element classifications and the quality element evaluation categories in the 1984 paper. To further illustrate, consider another example focusing on the “attractive quality elements,” which Kano defines (Table 1a) as “Quality elements that when fulfilled provide satisfaction but when not fulfilled are acceptable.” Respondents, however, do not rate the quality elements on varying degrees of satisfaction and varying degrees of acceptance. Rather, in the 1984 article, these elements are rated as being different kinds of “feelings” denoted by the terms “like,” “acceptable,” “no feeling,” “must-be,” “do not like” and “other.”
Consider the problems this causes. Take the attribute “TV picture forms quickly” (a functional attribute from the 1984 article).6 Kano implies that if a respondent selects “like” for this attribute, the attribute causes satisfaction. For the dysfunction question, “TV picture forms slowly,” if the same respondent selects the feeling “acceptable,” Kano classifies this attribute (Figure 3) as being in the attractive evaluation category, which is logical given his framework. But Kano also classifies in the attractive evaluation category a respondent who selects “like” for “TV picture forms quickly” and then selects “must-be” for “TV picture forms slowly,” which makes no sense because this pair of answers is absurd.
Sensitivity of Kano results to attribute wording. Clearly, changing attribute wording can change survey results. If you review the Kano model literature, however, there seems to be an implicit assumption that “consumers’ evaluations of a given attribute in terms of provision/non-provision are the same (or at least similar) to consumers’ evaluations of the same attribute in terms of high/low attribute-performance,” say Josip Mikulic and Darko Prebežac in a recent Managing Service Quality article.7 They tested this hypothesis with two different ways of wording Kano’s functional/dysfunctional quality elements. The first set refers to whether an attribute is present or not:
Q1a functional: “When opening a new bank account, how would you feel if you were provided with a mobile banking service?”
Q2a dysfunctional: “When opening a new bank account, how would you feel if you were not provided with a mobile banking service?”
The alternative wording focuses on level of bank performance (high/low):
Q1b functional: “When opening a new bank account, how would you feel if you were provided with a mobile banking service that works very well?”
Q2b dysfunctional: “When opening a new bank account, how would you feel if you were provided with a mobile banking service that works very poorly?”
When the present/not present wording was used, respondents placed the mobile banking service in the “attractive” evaluation category 59 percent of the time. When the high/low performance wording was used, this figure dropped to 22 percent. As the authors conclude, “It is apparent from this illustrative example that the classification of the attribute varied significantly – depending on how [the attribute] was defined and operationalized.” (page 50)
Psychometric validity of the Kano scale. A minimum requirement for a valid measurement scale is that it is one-dimensional. As discussed by Jum Nunnally in his book, Psychometric Theory, measurement “consists of rules for assigning symbols [often these symbols are numbers, such as in a seven-point rating scale] to objects [attributes or quality elements] so as to (1) represent quantities of attributes numerically (scaling) or (2) define whether the objects fall in the same or different categories with respect to a given attribute (classification).”8 In other words, individual scales are supposed measure just one thing. For example, marketing research textbooks warn against using “double-barreled” attributes such as rating a bank on having “friendly and fast teller service.”
Taking a look at Table 2, for purposes of explanation, I refer to the Kano scale used by MacDonald because this way of wording the scale is one that many authors use today (for reasons, by the way, that are not particularly clear).
Consider the responses “I can live with it that way” and “I dislike it that way.” Living with and like/dislike are two different concepts. How does a respondent, therefore, answer the functional form question if he both dislikes it but can live with it? Additionally, how does a respondent rate a quality element if he is both neutral toward it but can “live with it”? Does he select the scale point “I am neutral” or the scale point “I can live with it that way”? Similar confusion can be caused between the scale points “I like it that way” and “It must be that way.”
Kano model controversy
Why is the Kano model so controversial?
The Kano model did not originate in marketing. Kano’s paper was published in the Journal of the Japanese Society for Quality Control. In citing the literature upon which their article is based, the authors reference books and articles in the field of philosophy twice and quality control and analysis 30 times – with no references to the marketing literature.
Kano’s review of the literature, for example, did not reference Paul E. Green and Yoram Wind’s 1975 Harvard Business Review article, “New way to measure consumers’ judgments,” which introduced conjoint analysis to the marketing industry and which appeared nine years before Kano’s publication! Green and Wind’s method can estimate the non-linear relationships in Figure 1 but Kano’s can’t!
Omission of psychometric measurement considerations. Psychometrics is the study of measurement validity and reliability. Green and Wind anchored their conjoint analysis methodology in the field of psychometric measurement. They stated:
“… in recent years researchers have developed a new measurement technique from the fields of mathematical psychology and psychometrics that can aid the marketing manager in sorting out the relative importance of a product’s multidimensional attributes.”
Although you will find articles that test various ways of wording the Kano scale, my literature search did not uncover any articles specifically examining the psychometric properties of the Kano scale.
Kano results and face validity. Ironically, the Kano model often produces results that are reasonable, if not face-valid. There are several reasons for this: 1) because of time and cost constraints, only quality elements deemed “important” by management make it onto surveys; 2) consequently, respondents rate most attributes “like” or “acceptable” on the functional question and “do not like” on the dysfunctional question, resulting in the model classifying many elements in the one-dimension or must-be evaluation categories. For example, Kano’s 1984 paper gives quality element classifications for 19 attributes across two studies, of which 15, or 79 percent, are classified in the one-dimension or must-be categories.
But reasonableness and face-validity are poor arguments to make in supporting a methodology and here’s why.
First, findings derived from a poor methodology are sometimes similar to a more accurate methodology’s findings. If you assume that the sun revolves around the Earth, you can construct a highly mathematical model that predicts the seasons and planet locations in our solar system with a relatively high degree of precision. But the Earth-centric model is wrong.
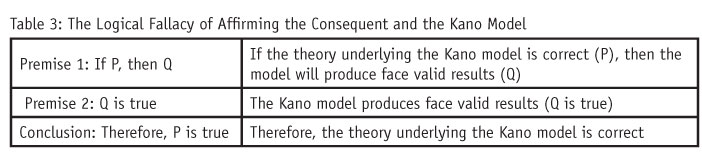
Second, if a model’s predictions appear valid, to think that the theory underlying the model is necessarily valid is to create a logical fallacy. This fallacy is called affirming the consequent and is illustrated in Table 3. The conclusion, “Therefore, P is true,” does not follow from the premises. There can be other factors that make Q true other than P. In the Kano case, the Kano scale can often differentiate quality elements that don’t affect satisfaction vs. those that do – although this discrimination is like looking through a microscope with a 10x power lens versus using a conjoint “microscope” with a 200x power lens.
Third, methodologies must pass theoretical scrutiny first before one can justify using them in a practical setting. Although it is true that all marketing research methods have theoretical shortcomings, one should attempt to minimize these problems whenever possible.
Consequently, a) the multi-dimensionality of the Kano scale; b) the vagueness of the Kano model’s terminology; c) the potential respondent confusion when interpreting scale points (beyond what might expect with a typical Likert-type scale); and d) the illogical combinations of selected functional and dysfunctional answers to Kano scale questions bring into serious question this model’s veracity.
Recommendations
The preceding discussion makes a strong argument, grounded in the literature, for not using the Kano model. Therefore, I recommend using conjoint-type methods to examine product design questions similar those addressed by Kano.
There are, however, many times when budgets don’t allow clients to field a conjoint study. What do you do in those situations? Here are some suggestions:
Qualitative research: Rely more on qualitative research to understand the nature of the consumer decision and product evaluation processes and use this knowledge to shed light on product design questions; conduct in-depth one-on-one interviews instead of focus groups to gain this insight; give respondents conjoint stimuli, have them identify the products they would most likely purchase and then question them about their decision processes (e.g., how do they trade-off different conjoint treatment attribute levels, etc.).
Quantitative research: Conduct monadic tests of different product profiles in which only one attribute is changed from one monadic sampling cell to another; examine how changing one attribute at a time affects consumer brand preferences and attitudes.
Realize that if you don’t use a conjoint-type approach to investigate product design questions involving product-feature trade-offs, you have to fall back on the use of direct questioning methods – e.g., “What’s the likelihood you’d purchase X, if Y were changed in the following way …?” In these cases, professional marketers and marketing academics generally agree that these direct-questioning approaches are inferior to indirect conjoint-type methods.9
Regardless of which method you use, all research methods have shortcomings. In part this is because marketing research is an imperfect social science. We cannot include all the factors in our models that influence consumers to purchase products and brands. Many of these factors play dual roles of being both effects and causes (e.g., perceived product quality is a potential cause of brand choice but perceived quality is also, in part, an effect of a product’s price). Our models cannot measure all of these interconnected and contingent relationships and our measures of many of these factors are imprecise. Finally, survey research is conducted by asking respondents contrived questions in artificial environments.
Bottom line: You need to use the best research tools possible combined with your knowledge of the industry and good judgment in making inferences on how best to design or change a product’s design. And stay away from Kano.
REFERENCES
1 Kano, Noriaki; Nobuhiku Seraku; Fumio Takahashi; Shinichi Tsuji (April 1984). “Attractive quality and must-be quality.” Journal of the Japanese Society for Quality Control (in Japanese) 14 (2): 39-48. (E-mail me for an English translation of Kano’s original article.)
2 Gregory, Amy M. (2011). “Assessment of product and service attributes and consumers’ willingness to pay in the vacation ownership industry using the Kano model and conjoint analysis.” Ph.D. dissertation, College of Education, University of Central Florida.
3 Shahin, Arash; Masoud Pourhamidi, Jiju Antony and Sung Hyun Park (2013), “Typology of Kano models: a critical review of literature and proposition of a revised model,” International Journal of Quality and Reliability Management, Vol. 10, Issue 3, pp. 347.
4 Example drawn from Gregory (2011).
5 MacDonald, E., Backsell, M., Gonzalez, R., and Papalambros, P., 2006, “The Kano method’s imperfections, and implications in product decision theory,” International Design Research Symposium, Seoul, Korea, November 10-11.
6 Kano does not give the complete attribute definition in his 1984 paper. The wording given is my best inference to what they actually used in the paper.
7 Mikulic, Josip, and Darko Prebežac (2011). “A critical review of techniques for classifying quality attributes in the Kano model,” Managing Service Quality, Vol. 21., No. 1, p.49.
8 Nunnally, Jum C., and Ira H. Bernstein (1994). Psychometric Theory, McGraw-Hill, third ed., (New York).
9 See a variety of technical papers on this topic at www.sawtoothsoftware.com/support/technical-papers