Must-be or not must-be?
Editor's note: Michael Latta is executive director of YTMBA, a Myrtle Beach, S.C., research and consulting firm. He is also the associate dean, a professor of strategic marketing, and the Colonel Lindsey H. Vereen Endowed Business Professor in the Wall College of Business Administration of Coastal Carolina University.
Quantitative new-product design surveys in the business-to-business realm are used to answer the following types of questions: What need does the customer desire the product to fill? What problem does the customer want the product to solve? What attributes does the customer want the product to have? What features does the customer want the product to have? What benefits does the customer want the product to provide? The answers to these questions are typically expressed in terms of product attributes, features or benefit statements.
A variety of methods have been developed to answer these questions including: stated importance from rating scales; derived importance from rating scales; conjoint analysis from experimental designs; discrete choice from experimental designs; and Kano method from paired comparisons.
The Kano method has been used in a variety of preference study types including the popular customer satisfaction survey. It has also started to be used in new product development surveys. The basic approach involves a version of paired-comparisons. Paired-comparisons have been around since 1927 when Louis Leon Thurstone proposed his law of comparative judgment which needed a method of measurement. The method of paired-comparisons was used to operationalize the definition of psychological value differences expressed in a product attribute, feature or benefit.
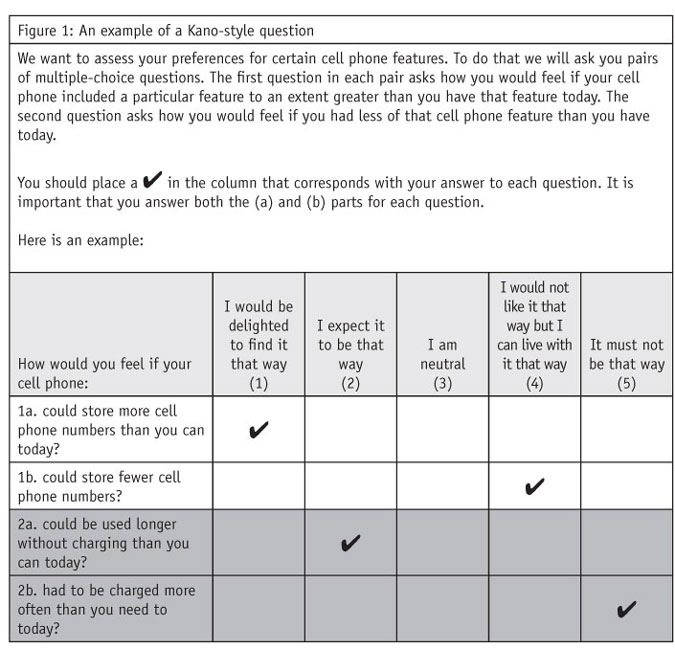
Each product attribute, feature or benefit is expressed both in a present or positive way and in an absent or negative way. An widely-used example of how such measurement is done is shown in Figure 1.

This approach to measuring product preferences has a theoretical orientation based on determining what new features are expected to be included, what attributes add psychological value as they increase and what attributes are deal-breakers if absent and exceed expectations if included.
The Kano model was developed by Noriaki Kano. He is an expert in product quality design who described the complexities of customer needs and their relationship to customer satisfaction as the most important design issue. Users of the Kano method have identified six basic types of psychological values defining product attributes, features or benefits relating to customer needs, problems or benefits. These values go by various names but are most often expressed as follows: Attractive; One-Dimensional; Must-Be; Indifferent; Reverse; Questionable.
Attractive: Attributes, features or benefits that elicit product acceptance when completely present but do not cause rejection of the product when not present. These values are not typically expected in a new product. An example is the button-less iPhone when first launched.
One-Dimensional: These are attributes, features or benefits that everyone is aware of and are the basis of direct competition. These features, attributes or benefits result in product acceptance when present and product rejection when absent.
Must-Be: These values are taken for granted when present but result in rejection of the product when absent.
Indifferent: These values are neither good nor bad and have no effect on the customer’s preference for the product.
Reverse: When these values are absent, the customer is accepting of the product. If the value is present the customer rejects the product. These values show that not all customers are alike on certain attributes, features or benefits. One customer segment may strongly prefer an attribute and another may be strongly opposed to an attribute.
Questionable: Response patterns show ambivalence, misunderstanding of the questions or errors made in answering questions. The result is, the same answer is given to both expressions of the same attribute feature or benefit. In other words, the respondent both likes and dislikes the product and the value expressed.
The Quirk’s archives contain articles on the use of the Kano method (see references). Each of these articles, along with this one, can be helpful when designing a survey and indicates some of the pitfalls that may occur when using the Kano approach.
Not internally consistent
The unusual structure of a Kano questionnaire is a potential problem in surveys. Threats to the reliability and validity of results come from Reverse and Questionable values, which signal respondents have given answers that are not internally consistent or are contradictory. The pattern of responses indicates straightlining, confusion, “had no opinion but did not check neutral” or that the respondent simply did not read the questions. It is also hard to tell if certain questions should be discarded or if respondents need to be discarded or if respondent reading ability just is not up to the complicated Kano task.
This last issue may be a particular problem with international studies in technology areas where translations are problematic and comprehension may be an issue. Internationally, Kano may work best using an online survey with panels. Kano requires that the respondent have expertise and experience in the product area and be allowed to go back and forth among the statement pairs as often as he or she needs to. This atypical survey need results from the paired-comparisons approach requiring a lot of thought, which makes flexible online methods a good choice. The online panel assures respondents who potentially can understand and answer the technical questions. However, whether the method gets “lost in translation” is an empirical question answered in a study summarized below.
Method
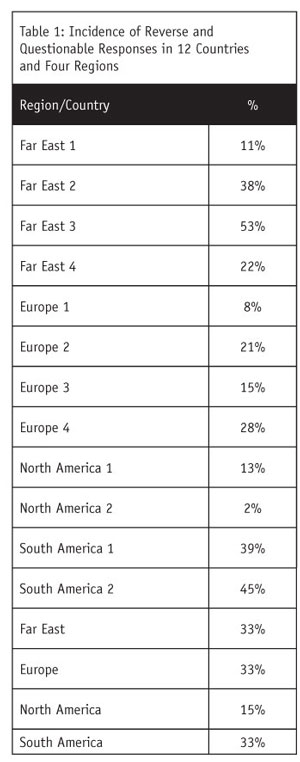
An international survey of medical specialties was conducted in North America (two countries), South America (two countries), Europe (four countries) and in the Far East (four countries). In total, 1,114 respondents were surveyed using the Kano method. The research-on-research objective was to determine the incidence of Reverse and Questionable responses in the various countries to see if Kano is equally reliable in all cases or if it works in some countries and regions better than others.
Results
The results indicate that questionable responses occurred in all 12 countries. The incidence of Reverse and Questionable responses are presented in Table 1 for the 12 countries and aggregated by the four regions. As can be seen in Table 1 these incidences vary between regions and between countries within regions. For example in the Far East the values range from 11 percent as a low to 53 percent as a high, suggesting at least one Far East country is not a good option for Kano. In addition, North America shows much lower values compared to South America. Overall, Europe, the Far East and South America all show twice the incidence of Reverse and Questionable responses compared to North America.
Implications
Although this pattern of Questionable and Reverse responses may not be surprising to those who use the Kano method, it does suggest that marketing research field services need to take this information into account when planning international panel survey research projects involving Kano. There is no rule-of-thumb in widespread use for discarding respondents with Reverse or Questionable response patterns. One might reasonably set 20 percent as a threshold.
The complexity of the Kano method of paired-comparisons results in inconsistent patterns of responses, leading to some problems in application, especially in international studies where translations are involved. High percentages of Reverse and Questionable value responses make the data difficult to use in technical or medical new-product design studies. The question addressed here is: Do the percentages of Reverse and Questionable value responses from international panels vary across countries, indicating that the utility of the Kano Method varies from country to country? The answer is yes.
References
Farace, V. and Mike Swenson. “Assessing customer requirements: the Kano method.” Quirk’s Marketing Research Review. Article ID: 19981002. October 1998.
Goncalves, K.P. and Michelle Goncalves. “Working with the Kano method.” Quirk’s Marketing Research Review. Article ID: 20000502. May 2000.
Kano, Noriaki, Nobuhiku Seraku, Fumio Takahashi, Shinichi Tsuji (1984). “Attractive quality and must-be quality” (in Japanese). Journal of the Japanese Society for Quality Control 14 (2): 39–48.
Lieberman, M. “Data Use: Design performance: the Kano model.” Quirk’s Marketing Research Review. Article ID: 20081008. October 2008.
Editor's note: Michael Latta is executive director of YTMBA, a Myrtle Beach, S.C., research and consulting firm. He is also the associate dean, a professor of strategic marketing, and the Colonel Lindsey H. Vereen Endowed Business Professor in the Wall College of Business Administration of Coastal Carolina University.