Editor's note: Michael Lieberman is founder and president of Multivariate Solutions, a New York-based research consulting firm.
Big data. Tell the story. Take a seat at the C-suite table. Be involved in the decision-making dynamic.
These themes are repeated at marketing research conferences such as the ESOMAR Big Data Event in Berlin, CASRO and the Marketing Research Association, as well as those held in related industries, such as predictive analytics and forecast modeling. Even at a recent decision theory (or game theory) conference, someone took to the stage to discuss how to influence decision-makers.
After many years of digesting these presentations, forming strategic alliances across skill sets in the marketing research industry and waving hello and goodbye to new phases – data torrents as well as to the new data scientists – I would like to discuss a possible avenue our industry may take: data fusion.
Like the merging of qualitative research with quantitative analysis, data fusion is a mixture of traditional marketing research skills and the continuing expansion of bandwidth. There is now a plethora of open-source software available, as well as consumer and social media data. So many tools, so much data. One message is coming through clear as a bell: clients and C-suite executives want to hear the story.
Who will tell it? Marketing researchers.
Predictive analytics
Predictive analytics and marketing research are two distinct fields. However, both industries employ data scientists. The former targets endeavors such as investments and commercial and security applications of advanced analytics including text mining, image recognition, process optimization, cross-selling, biometrics, drug efficacy, credit scoring, sector timing and fraud detection.
When I attended an international predictive analytics conference in San Francisco several years ago, I was surprised to hear that many of the people who regularly run optimization models for companies like Unilever, Proctor & Gamble and Levi’s use Excel. This same group had little experience in constructing surveys or writing the marketing narratives that constitute the core of marketing research reporting.
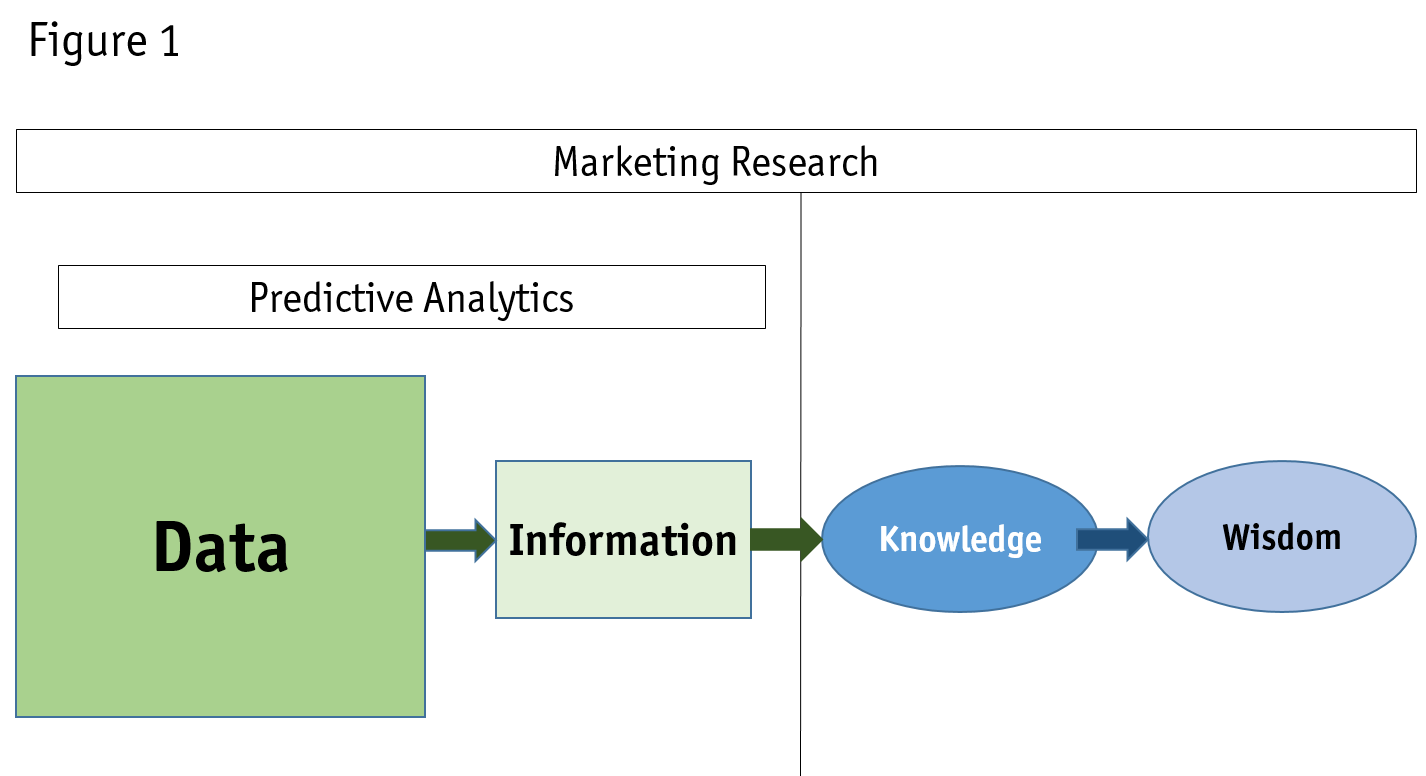
Marketing research teams regularly mine corporate databases to write up conclusions. I have done so in the past using the project path shown in Figure 1.

Predictive analytics professionals calculate results to maximize model efficiency – the data and information side of the chart.
On the other hand, reporting skills, combined with sophisticated analytical firepower, position marketing research professionals to interpret this data for the C-suite. This includes the right side of the project path – knowledge and information. It also opens the door for a researcher to grow into the role of strategic consultant.
Open-source software
For marketing researchers without a formal predictive analytics background, there are tools that can be used to perform predictive analytics or database mining. For readers who are not familiar with open-source statistical software, R is a free programming language for statistical computing and graphics supported by the R Foundation for Statistical Computing. The R language is widely used among statisticians and data miners for developing statistical software and data analysis. While there is a learning curve with R, marketing research professionals can certainly become proficient at using it.
In the past, one had to purchase expensive SAS licenses or many SPSS modules to achieve the firepower that is now available for free on the Internet. Below is a list of a few of the thousands of open-source modules contained in the R-Project:
- Bayesian inference;
- CHAID trees;
- feature selection regression;
- general linear models;
- logistic regression;
- machine decision list functions; and
- neural networks.
Each of the algorithms above can be used in day-to-day marketing research.
When I perform a conjoint analysis, I always provide the simulator in Excel. Why? Excel is huge. The published limits on Excel spreadsheets are 1,048,576 rows by 16,384 columns in one workbook! Databases can easily be separate workbooks. Unlike specialty conjoint software, everyone has Excel and it can provide a simple discrete model or the ability to easily create scenarios for a multi-dimensional exponential probability simulator. All Excel files can be brought into SPSS for data management and then saved into R.
The exchange of these files is simple using most data exchange services, such as Dropbox. Even boutique marketing research firms and corporate teams can receive and analyze large databases that only a few years ago required too much space.
Using the tools
Marketing researchers have the tools to perform predictive analytics or database mining and these tools will be increasingly available over time. While predictive analysts can certainly calculate a data set, when it comes to constructing questionnaires, summarizing findings and presenting them to a CMO, researchers win hands-down. Why? Researchers are trained in inductive reasoning, a crucial component of a project report that cannot be done by a program or tool – the knowledge and wisdom side of Figure 1 and the C-suite deliverable.
We take the data, process it with high-power, open-source software; we summarize the results and leverage strategic thinking. We fuse sophisticated predictive analytics capabilities with marketing research storytelling prowess to offer convincing conclusions. We can indeed do it all.