Editor's note: Paul Abel is a managing partner at Blue Research in the firm’s San Diego office. Kelsey Goings is senior market research manager at Blue Research’s Portland, Ore., office.
The popularity of Net Promoter Score (NPS) has skyrocketed since its introduction. The metric is currently being used by over a third (34%) of large corporations to assess and manage customer sentiment. NPS is often tied to executive compensation and, as reported by the Wall Street Journal, the metric is becoming a mainstay that is now touted in earnings calls (alongside earnings per share and corporate growth).
However, NPS has no shortage of critics. Many consider the metric to be inappropriate, unreliable and unsubstantiated.
For example:
- The concept is based on dot-com data from companies that no longer exist (e.g., EarthLink, TWA).
- The approach for capturing and analyzing results is faulty (e.g., the scale is unipolar/does not directly measure brand critics).
- The original assertion that higher NPS values correlate with higher corporate growth is unsubstantiated.
Not surprisingly, many executives find NPS values extremely difficult to change or can often change independently of the success (or failure) of customer-focused initiatives.
Unfortunately, organizations using NPS that may want to adopt a more appropriate and reliable metric of customer sentiment face many challenges:
- Processes are often well-established to monitor and manage resources based on NPS values.
- Changing to an entirely new metric requires significant efforts to align a multitude of stakeholders.
- Options that are “better than NPS,” easy to measure and simple to understand appear to be lacking.
This conundrum leaves two choices for business leaders: continue with the status quo, even though NPS values may not be meaningful (and NPS targets may not be achievable) or adopt a new metric of customer sentiment and attempt to change internal perceptions about a well-entrenched tool.
In this article we provide a third choice: increase the validity of this management tool.
We conducted a carefully designed survey completed by a representative sample of over 1,000 U.S. consumers. The results reported below use data that were focused on consumer perceptions and opinions about health insurance companies. This study was conducted blind with subjects screened to ensure they are not industry insiders. All of the data collected were carefully scrutinized to ensure only valid data were analyzed.
What did we find?
1. NPS values are a poor indicator of customer intentions.
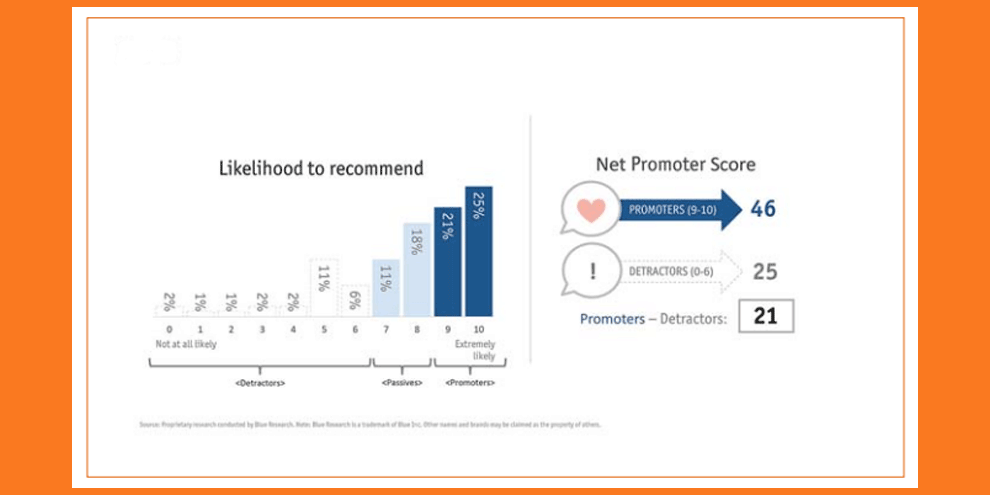
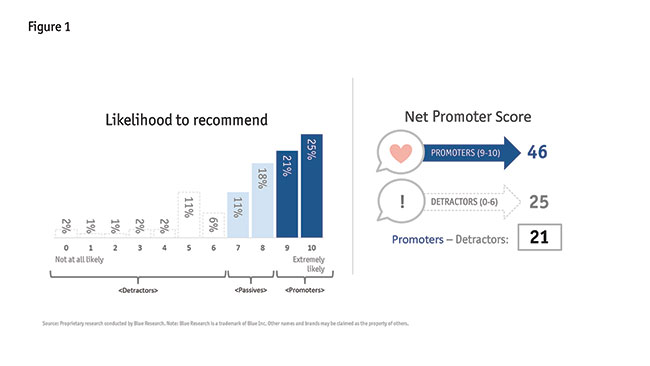
In the U.S. health insurance market, we found the 2019 NPS benchmark value is 21; overall, 46% are Promoters and 25% are Detractors of their health insurance plan (Figure 1). However, NPS categories significantly underrepresent brand advocates and overrepresent brand critics. When asked explicitly if they would recommend or deter others from their health insurance company, 63% report they would recommend their health insurance brand and 4% report they would discourage others from choosing their brand (Figure 2).
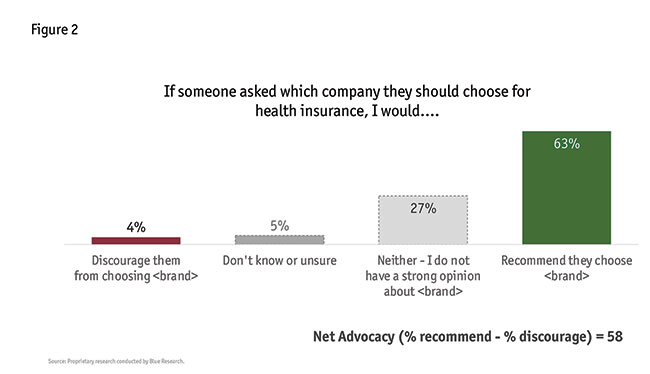
2. NPS values are a poor indicator of actual customer behavior.
Although 46% are categorized by NPS as Promoters, in fact, 59% of consumers have advocated for their brand. Moreover, while 25% are categorized by NPS as Detractors, only 6% have actually said something negative about it (Figure 3).
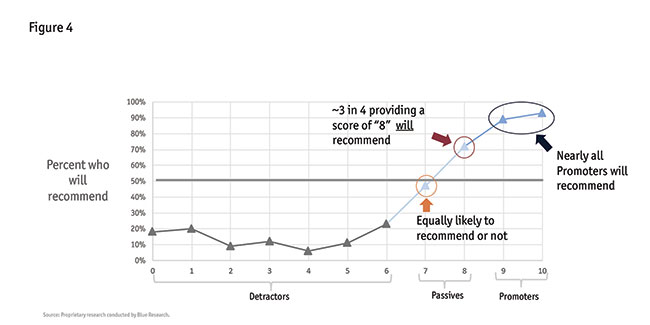
3. A critical error in NPS is placing a score of 8 in the wrong category.
An individual providing a rating of 8 in the “likelihood to recommend” scale is categorized as a Passive and ignored when deriving an NPS value. However, when those same individuals are asked explicitly whether they will recommend the brand, the wide majority (72%) admit to being a brand advocate (Figure 4).
4. To increase validity of using the “likelihood to recommend” scale, individuals must be categorized correctly.
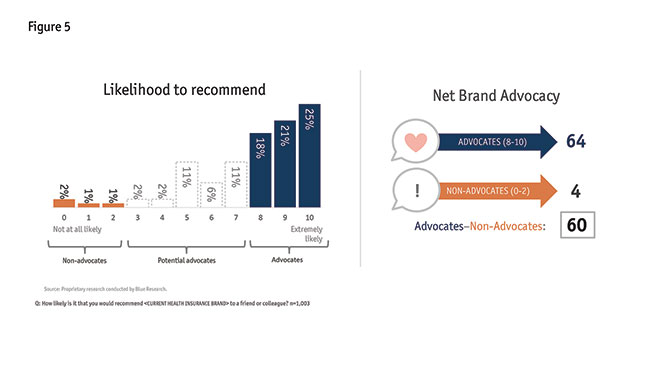
Given that the wide majority of those providing an 8 rating on the “likelihood to recommend” scale admit they will advocate for the brand, those individuals are best grouped with other advocates. Combined with those who report a rating of 9 or 10, the total percent of brand advocates from the data above is 64%. As shown above, that value closely matches stated intentions, where 63% admit they will recommend their brand. Thus, those individuals rating an 8, 9 or 10 are best categorized as advocates.
The combined percent of those rating a 3, 4, 5, 6 or 7 is 32%. This value is identical to those that state they are indifferent in what they would do (32%) and comparable to the percent that state they have neither said something positive nor negative about their brand (34%). Those individuals are best categorized as potential advocates.
Finally, the 4% of individuals who provide a numerical rating of 0, 1 or 2 on the “likelihood to recommend” scale is identical in value to the percent that say they would discourage someone from choosing their brand. This value is also comparable to the 6% of individuals who admit that they have in fact said something negative about their brand. Those individuals are best classified as non-advocates.
5. Using the appropriate categories, a more reliable measure of customer sentiment is obtained.
When asked directly, 63% admit they will recommend their brand and 4% report they will discourage someone from choosing their brand, resulting in a difference of 59% (63% - 4%).
A comparable value (60%) is derived by subtracting the percent of non-advocates from advocates categorized using the numerical ratings from the “likelihood to recommend” scale (see Figure 5).
A simple adjustment
Given its broad use and strategic importance, the validity of NPS values is critical for business leaders. By making a simple adjustment in how respondents are categorized, this study demonstrated how a “single score” can be derived that better represents true customer sentiment. Using this brand advocacy measurement enables organizations to increase their understanding of and influence on customer behavior, while leveraging the existing NPS-based “likelihood to recommend” infrastructure and framework that have already become widely adopted.