Editor's note: Michael Lieberman is founder and president of Multivariate Solutions, a statistical and marketing research consulting company based in New York. He can be reached at michael@mvsolution.com.
Traditional brand funnels assess consumers’ brand awareness, consideration, purchase, repeat purchases or favorite brand and loyalty. Their name comes from their nature – as the total number of consumers enter a brand funnel, the size of the pool of consumers narrows as they progress through it.
The goal of most brand funnels is to describe the different stages of a customer’s relationship with a brand. Here is a fairly typical brand funnel:
Awareness: Potential customers have heard about or come in contact with a brand.
Consideration: A potential customer develops a deeper relationship with a brand and seeks more information about it.
Purchase: The prospect now becomes a customer trialing a product of the brand.
Repeat purchase or favorite: The customer likes the brand or product and decides to purchase the brand again.
Loyalty: The customer only purchases that specific brand. If the brand is unavailable at a store they will seek it out elsewhere.
Within the framework of the brand funnel model initial research is to segment customers into a funnel, then research the best methods to move customers down the brand funnel. I have worked on these sorts of projects for 20 years in industries as variable as CPG, pharmaceuticals, electronics and the food-service industry and one technique I’ve found to be particularly effective is to lay out a road map to guide customers down the brand funnel. It is not predicated on one plan to move them in one fell swoop but rather individual guides to move them down one step at a time. The method I use is called comparative discriminant analysis and this article will give a simple, step-by-step template using a fictional casual-dining restaurant, Texas Grill Steakhouse, as a case study.
Case study: Texas Grill
Texas Grill is a national chain of steak-featured entrees that can found in many malls and shopping centers across the United States. Texas Grill competes for dining dollars with other major casual-dining chains such as Applebee’s, Olive Garden, Chili’s, Red Lobster, Hooters, LongHorn Steakhouse and TGI Fridays.

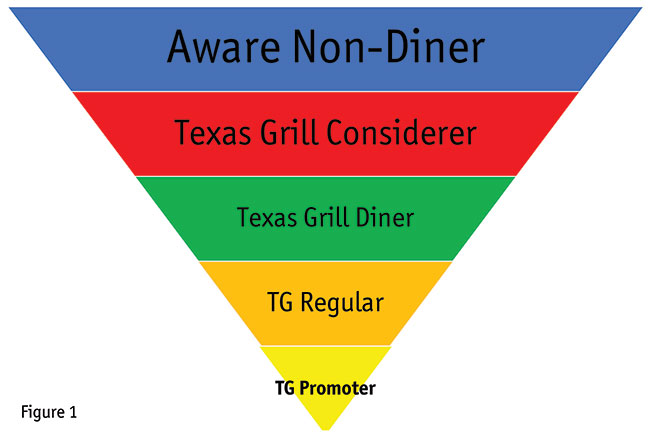
Figure 1 is an example of a Texas Grill customer pyramid. Customers are placed into each category by a segmentation back-classification screener. The study is conducted quarterly and, thus, each level of the pyramid is populated.
The quarterly report produces a research deck that follows a planned measure of metrics and analysis of key drivers, Texas Grill brand equity, social media analysis, pricing and measurement of menu item purchase. This quarter, though, the management at Texas Grill corporate headquarters would like to know how to move Texas Grill customers down their brand funnel. That is, from aware to consider, from consider to purchase, etc. Most importantly, from repeat to promoter.
Discriminant analysis is an a priori statistical technique – that is, the groups or dependent variables are predefined. The first requirement, then, is the groups. You need to have the groups defined. Multiple discriminant analysis, from which discriminant maps are drawn, is a case where you have membership from more than one group to define.
Characteristics of the grouping variable are simple. They are distinct, mutually exclusive and exhaustive. In the case of Texas Grill, we are looking within each level of the pyramid to define membership.
The target, or dependent variables, are constructed like this. For the first discriminant level, we begin with the aware category. All respondents in the survey have to be aware of Texas Grill, so the sample size in the first category is 1,000. However, as we move down the funnel, the sample size of the analysis shrinks to those customers who are in the next level.
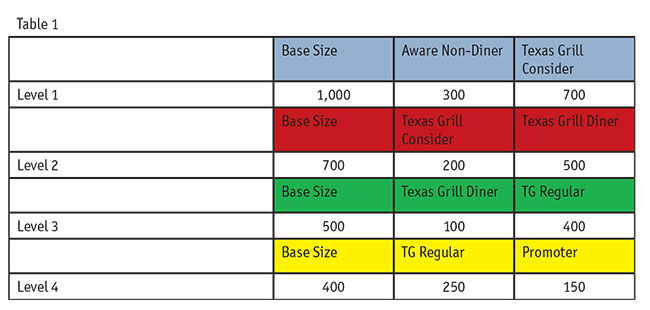
Table 1 illustrates the dependent variables and their respective sample sizes.
As we can see, the base sizes shrink as we descend the pyramid. In the first level, those who are aware, but not “Texas Grill consider” are coded a 0. Those who are “Texas Grill consider” are coded a 1.
In the next level, only those who are Texas Grill consider (700) are included in the analysis. Texas Grill diners = 1 (500), non-Texas Grill diners = 0 (200). And so on down the pyramid. Given that we have five levels of pyramid, we are looking at four separate discriminant analyses.
What gives the comparative discriminant analysis such power is its ability to use many parts of the survey to determine what motivates customers to move down the brand funnel. And for each level, we are looking at, essentially, a new analysis. This is a roadmap that gives not one set of directions but, in our case, four.
It is not unusual to use six or seven different sections of the survey in a roadmap analysis. However, to illustrate things we will simplify our analysis for Texas Grill and keep it to four brand arrays.
For Texas Grill, we are going to look at the following restaurant survey sections to determine how to move down the brand funnel: primary reasons for visiting Texas Grill; favorite Texas Grill menu items; rating the Texas Grill dining experience; negative statement about Texas Grill – brand barriers.
On the Texas Grill quarterly tracker, Texas Grill asks respondents 21 primary reasons they visit Texas Grill and other casual-dining restaurants. Let’s say that Texas Grill has 30 main items on its menu. Respondents are then asked to rate Texas Grill on 15 dining experience questions. Finally, respondents are asked if any of a list of 14 negative statements apply to their last Texas Grill visit.
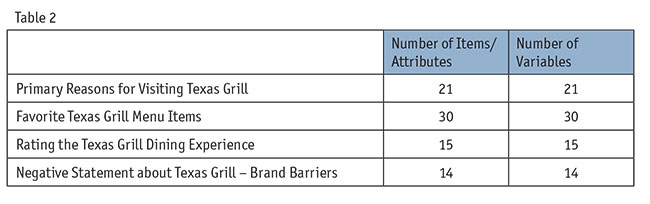
Table 2 shows how, for each item, performance rating and barrier we are creating a new variable. These variables are coded 1/0. If a respondent ordered an item, that item variable gets a 1, if not, a 0. If a respondent agrees with a statement about Texas Grill, the variable gets a 1, otherwise a 0. If a barrier, a 0, otherwise a 1. The variables created are summarized in the table.
There are four categories shown in the table. Thus we run four discriminant analyses for each level of the brand funnel – that is, we are running 16 analyses in total.
This technique is labeled a comparative discriminant analysis because we run the same analysis for all levels of the brand funnel. The one aspect that changes is the dependent variable as you work down the funnel. In this way, we are able to say which items, which performance and which barriers drive the respondent from one level to the next. We are, in effect, creating a roadmap.
To display the output for each level of the analysis would take up too much room. Table 3 is an example of how the discriminant analysis statistical output might look.
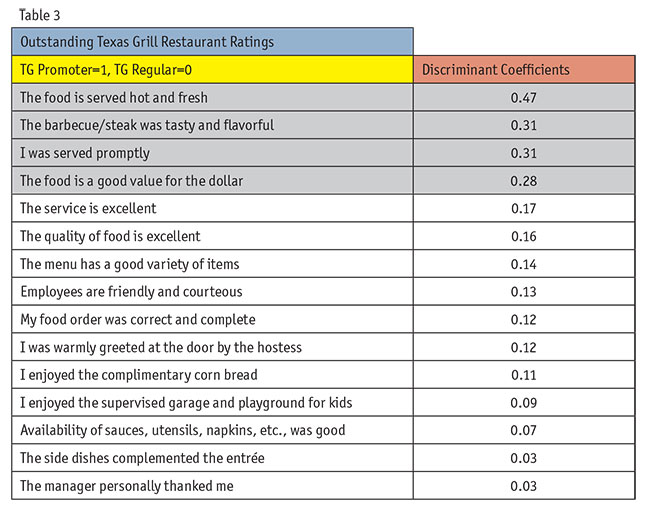
The simple interpretation of this table is that the top four attributes are discriminators between customers who are promoters of Texas Grill and those who are merely TG regulars. While the output of this chart may seem self-evident, it shows that an emphasis on prompt service and value can turn a regular diner into a word-of-mouth promoter of the restaurant.
The final step in this analysis is to summarize the discriminators across the four survey areas we used in the comparative discriminant analyses. We are showing, in Table 4, the discriminators between TG promoters and TG repeaters.
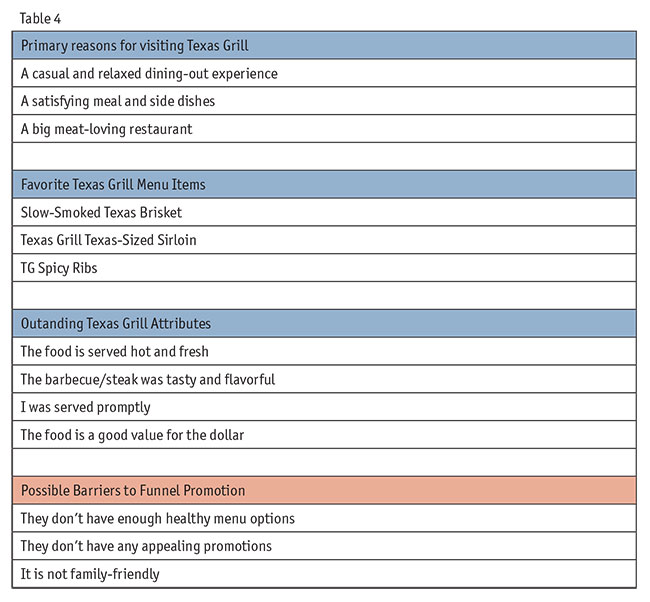
From this summarized table we know dining expectations, menu items, restaurant attributes and possible barriers to guide diners to the next level of Texas Grill brand funnel. Remember, with this analysis we produce four of these summary tables, one for each path of the brand funnel.
Remain relevant
Comparative discriminant analysis is one of several useful, agile methods that have been around since the invention of mathematics yet remain relevant options for today’s branding strategy needs. Marketers have access to more and more data but in order to mine actionable data insights, like how to move diners through a brand funnel, they can rely on researchers and data strategists who are skilled in applying the right tools to guide their clients.