Editor’s note: Mario X. Carrasco is co-founder and principal at ThinkNow, an insights agency based in Burbank, Calif. This is an edited version of a post that originally appeared under the title, “‘Hispanic’ preferred over ‘Latinx’ by Hispanics when describing ethnicity.”
On November 1, 2019, we published a blog on Medium exploring the wide range of ethnicities by which Hispanics identify. Among them was the controversial term “Latinx.” That post quickly became the most read blog in our company’s nine-year history and went on to be cited by the Washington Post, New York Times, The Atlantic and many other publications. The media attention garnered both praise and criticism from readers, some of whom didn’t agree with the outcome of the study so they questioned our methodology despite our accurate sample frame and weighting tactics. Given the overwhelming response to our research, we decided to do a follow-up with double the base size – 1,000 respondents this time – and added an LGBTQ over sample.
The goal of our updated report (registration required) discussing these new findings is to provide companies, brands and politicians deeper insight into how U.S. Latinos prefer to describe their ethnicity.
Below are some key takeaways:
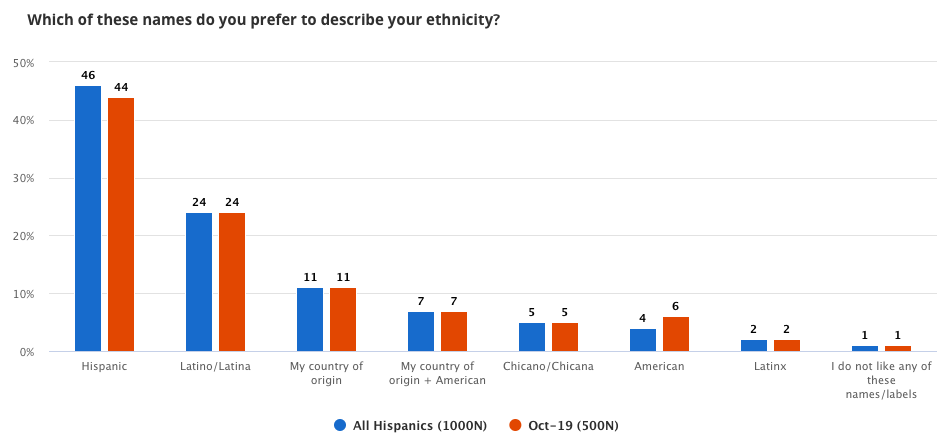
“Hispanic” is preferred by Latinos when describing their ethnicity.
Doubling the base size from 500 to 1,000 respondents had little to no impact on the results of this preference question.

The research again showed that “Hispanic” is ranks highest among Hispanics, followed by “Latino/Latina.” “Latinx,” on the other hand, has ranked last in both of our surveys.
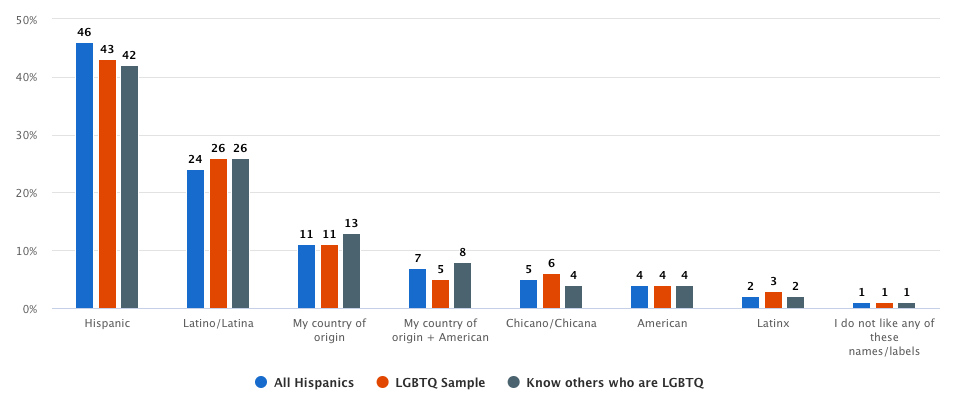
“Hispanic” is favored among Latinos who identify as LGBTQ when describing ethnicity.
Another valid concern regarding our October Latinx study was the representation of LGBTQ respondents as the term “Latinx” was, in part, coined to address the gendered nature of terms like “Latina/Latino.” To address this methodological concern, we included an oversample of 11% (114 respondents) who identify as LGBTQ. Furthermore, we included a sample of 360 respondents who are not LGBTQ themselves but know others who are. “Hispanic” is preferred, while “Latinx” barely registers.
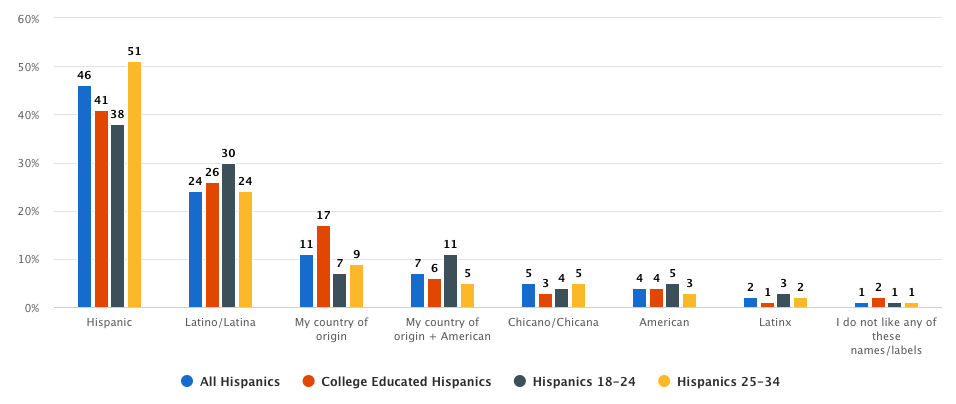
“Hispanic” is preferred among college-educated and higher-income Hispanics, as well as Hispanics ages 18-44.
The assumption that college-educated Hispanics or younger Hispanics prefer the term “Latinx” is not supported in the data. Across all cohorts, preference for “Hispanic” rises to the top and preference for “Latinx” remains consistent, never rising about the 3% mark.
Some interesting directional differences to point out (none cross into the threshold of statistical significance, however):
- Hispanics 18-24 have the lowest preference for the term “Hispanic” among the selected cohorts at 38%. Conversely, at 30%, they are the cohort to prefer “Latino/Latina” the most.
- College-educated Hispanics are the most likely to prefer using their country of origin to describe their ethnicity.
- Hispanics 18-24 are the most likely (11%) to prefer using their “country of origin + American” to describe their ethnicity.
More Hispanics dislike the term “Latinx” vs. those who like it.
We asked respondents to indicate how they feel about the term “Latinx.” Below are the results:
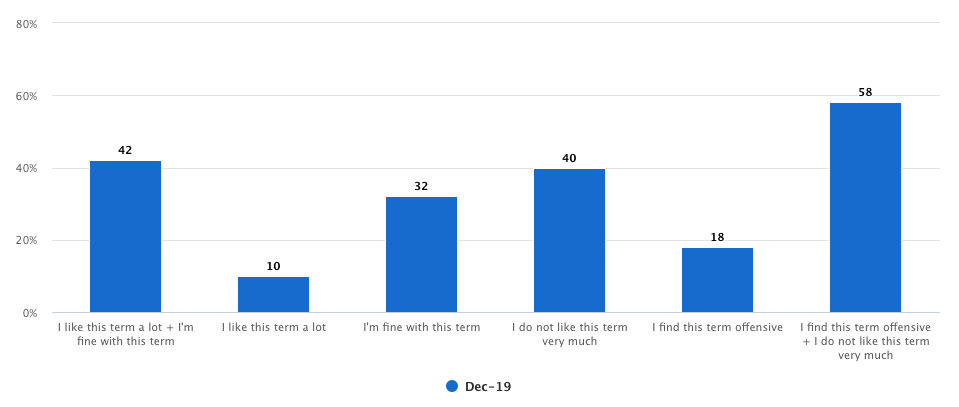
Almost 60% of respondents either don’t like the term very much or find it offensive.
The results are clear. Hispanics, overall, prefer to be referred to as “Hispanics” or “Latinos.” While the origins of “Latinx” are noble and signal a more inclusive mind-set, companies, brands and politicians looking to connect with Hispanics should consider this research before attempting to win over Hispanic consumers and voters. Even the best intentions will fall flat if you are out of touch with your audience.
Methodology:
- ThinkNow conducted a nationwide online survey of 1,000 Hispanics in December 2019.
- All respondents were 18 years of age and older.
- The sample was weighted with respect to age, gender, U.S. region and household (HH) income, per U.S. Census benchmarks.
- The table below shows a demographic profile of the sample:
Total Hispanics
(n=1,000)
Male
51%
Female
49%
Age
18-24
19%
25-34
26%
35-44
24%
45-54
19%
55-64
12%
% Foreign Born
40%
% Mexican Origin
63%
Median Annual HH Income
$45,000
Language spoken at home:
Spanish only
11%
Spanish mostly
24%
Both equally
35%
English mostly
18%
English only
12%
Region:
Northeast
14%
Midwest
9%
South
37%
West
40%