
A map on the road to recovery
Editor's note: Tom Donnelly is head of MedTech at Branding Science. He can be reached at tom.donnelly@branding-science.com. Mary Putman is lead digital strategist at Stone Mantel. She can be reached at maryputman@gostonemantel.com. Sam DePasque Swanson is research manager at Branding Science. She can be reached at samantha.swanson@branding-science.com. Pam Rubio-Soletto is associate director at Branding Science. She can be reached at pam.rubio-soletto@branding-science.com.
The acceleration of digital health tool (DHT) use, along with patients’ increased willingness to provide nontraditional data, has provided the health care community the opportunity to improve health care outcomes for patients and health care practitioners. In this article, we will discuss key points in patients’ journeys where health tools can be most impactful, as well as the types of data that can be leveraged to improve patients’ journeys across acute, chronic and wellness paths.
DHTs encompass a variety of options and have scattered use depending on the specific tool, type of journey and stakeholder using it. Some DHTs are useful for patients (e.g., health trackers), some provide critical information for health care practitioners (e.g., home monitoring) and some are provided by payers (e.g., telehealth, apps for chronic health issues). Companies that manufacture DHTs have diverse goals in the development of their offerings, ranging from disease prediction, health monitoring and adherence motivation.
When considering how DHTs can be leveraged to improve patients’ journeys, it is useful to examine the framework of standard patient journeys. Often, a patient journey is developed by a company to better understand patients’ needs and where intervention may be useful. Thus, many journey maps are disease-specific and most do not include digital experiences, tools or support. They are often missing potentially useful elements such as emotional data, data sharing, input from a health advocate or family member and the individual’s own goals and motivations.
Methodology
This research was conducted by the Digital Healthcare Collaborative (DHC), a collection of thought leaders from pharmaceutical manufacturers, solutions providers, medical systems and health insurance companies. Each year, the DHC conducts several rounds of research as part of an innovation process to leverage digital tools to improve patient outcomes. We focus on the future of patient/population experiences and engagement solving for the next two-to-five years. The real strength of the group is that we are solving common problems and are not limited to the lens of one company.
The research described includes qualitative research (described below), followed by two online surveys: a 20-minute survey with 1,064 patients conducted March-April 2020; a 20-minute survey with 1,443 patients conducted March-April 2021. Both were demographically representative samples of the U.S. using Dynata’s panel.
The preceding qualitative research included homework exercises, one-on-one discussions, focus groups and web-enhanced tele-depth interviews to understand patient journeys and the need for digital solutions. The sample included 25 patients in the summer of 2019 and 30 additional patients that fall. All respondents were adult smartphone users and had to fit one of the following criteria: had an acute medical event in the past year (involving surgery/hospital stay or an urgent, emergency medical event); diagnosed with a chronic condition; currently focused on/interested in improving their health and wellness.
Smart/genius framework
To help respondents describe their unmet needs in a way that would help manufacturers conceptualize future tools, we developed a framework to discuss the use of DHTs. For a detailed description, please see our article in the November/December 2020 issue of Quirk’s (“Empowering or powerless?” https://bit.ly/35DVumG) Since that time, we have changed “stupid” to “frustrating” and “dumb” to “not smart.”
Frustrating: Collects some data but uses it wrong or should be using data and it’s not, making the experience the worse than it used to be. Feels frustrating.
Not smart: Doesn’t use data but gets the job done. Could be improved by using data or if it was digitized. Feels unintelligent.
Smart: Uses data to make the experience easier/better than it used to be. Feels smart.
Genius: Uses data to make the experience truly helpful, create better health outcomes and/or predict things for you. Feels genius.
Results
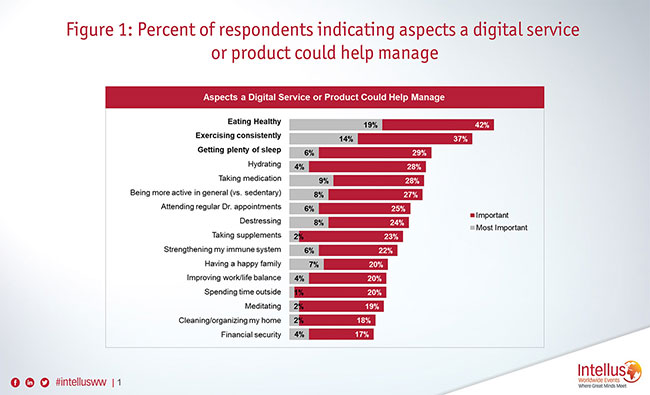
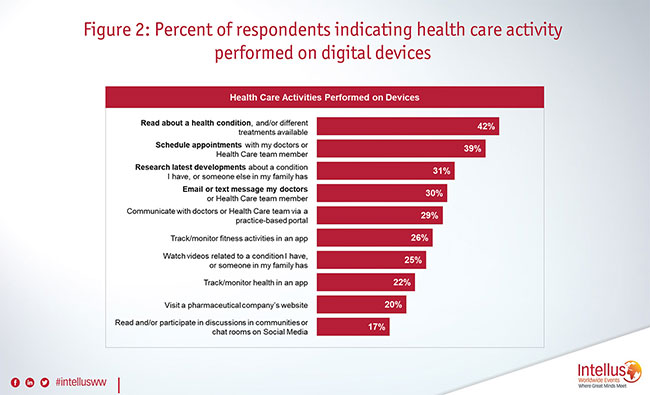
Overall, most respondents feel a digital tool could help them manage their health and well-being. Diet, exercise and taking medication are the most important aspects that a digital product can help (Figure 1). Digital health tool usage increased from 66% in 2020 to 81% in 2021, playing a significant role in most people’s lives. Devices are commonly used to research conditions and schedule appointments (Figure 2). There is an increasing level of desire for the use of digital health tools and an increasing use of digital devices to improve health.
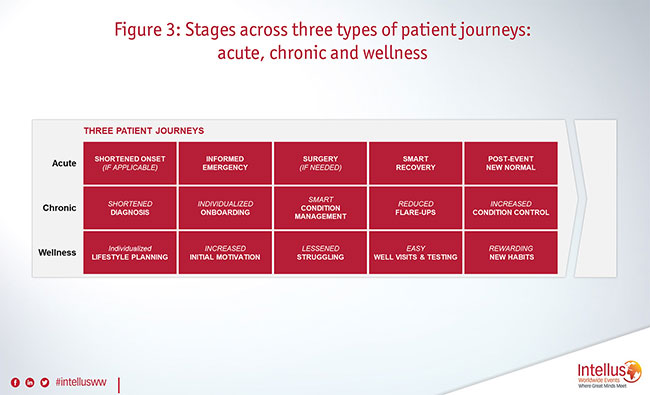
The research examined three different health journey archetypes to better contextualize data usage. We created detailed journey maps that included self-care, health care team and health care industry components for jobs to be done, health advocates, smart digital support, prediction virtual support, managing emotions, digital tools, data, resources and individualization. Figure 3 shows an overview of the stages of the three types of journeys: acute, chronic and wellness.
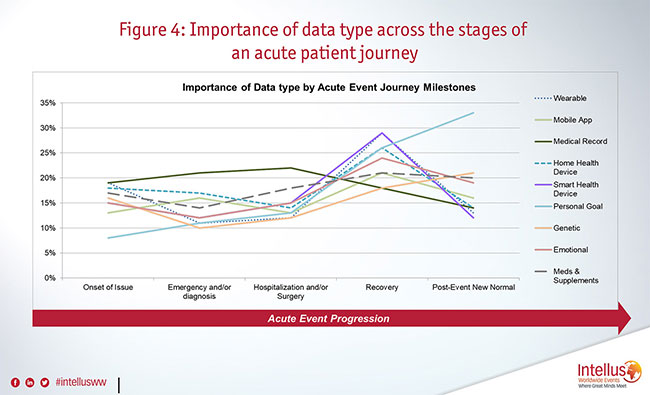
Patients on an acute journey were asked about where they felt a digital health tool would be most effective. Improving or making the onset of an acute event easier to go through is the biggest need for patients who’ve suffered a recent health emergency or serious medical event. Different types of data are important at different stages of the journey, with a data importance spike during recovery (Figure 4).
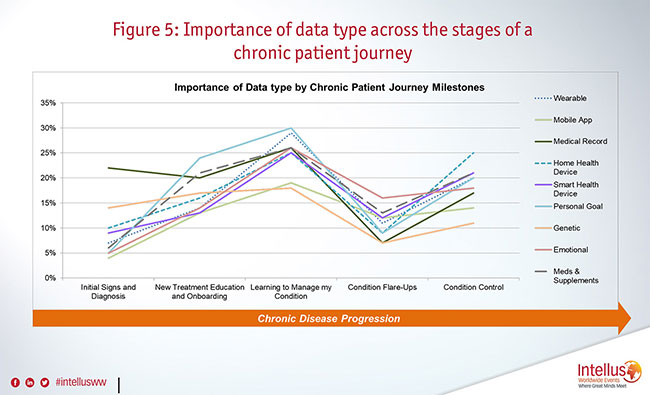
Chronic patients feel that the most important types of data for improving a majority of milestones is directly tied to their personal goals and emotional well-being versus data measuring their physical health. The relative importance of data shifts more drastically among those with a chronic illness; patients believe data is most important in relation to learning to manage or control their condition (Figure 5).
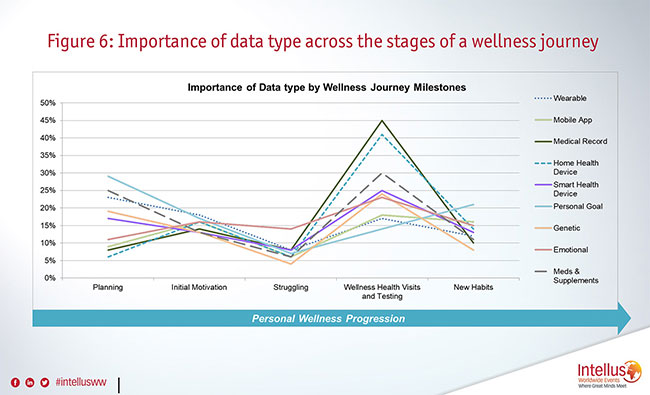
Of the three journey types, wellness had the most variance of data importance across milestones, with consumers feeling data is most important during health and wellness visits (Figure 6). Similar to the chronic and acute patients, wellness consumers feel a truly helpful health tool is most important during the initial milestone of their journey as they figure out to fit health into their life.
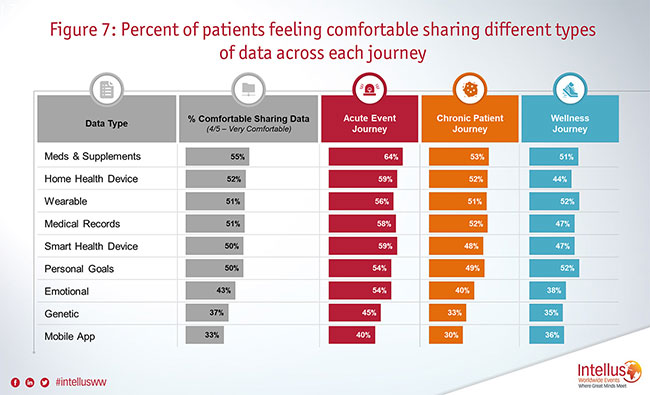
Respondents were asked about the types of data they felt comfortable sharing and with whom. Patients are comfortable sharing more traditional types of health data if it means receiving truly beneficial tools; however, emotional, genetic and mobile app data are less likely to be shared – especially with an insurance company compared to an HCP. Types of data patients feel more guarded about holds true across health and wellness journey types, though those who have experienced an acute event are more willing to share their data (Figure 7).
The qualitative research indicated that using emotional data to support well-being will become more accepted over time. Patients are receptive to emotional data being used to help moderate the emotional roller coaster they feel every day. They recognize that stress and negative emotions have a major impact on their health and well-being and therefore most welcome their emotional data being used support them through digital and human interactions (and experiences that are a mix of both). For the wellness journey, they want emotional data used when they are struggling and during physician visits. For the acute journey, emotional data is most important to support recovery. For the chronic journey, patients want help during condition flare-ups.
Different milestones
How can we use technology to improve the patient journey experience? People feel that data can be used to improve different milestones within different journeys. The common thread among all types of journeys is the need for a truly helpful health tool during the initial milestone of their journey. A key watch-out for all the tools is that the user needs to know how data is being used to help them at point-of-use. Show them how the data is being used and assure them their data is safe and will not be used against them.
For the acute journey, the tool people are most interested in is one that helps during the onset of the issue using their medical record and wearable data to help with diagnosis. For a simple diagnosis, this is a tool for their doctor but for a complex diagnosis, the patient and doctor need to use the tool together.
The next-best patient tool is one that helps with recovery and the post-event new normal. Depending on the acute event, that tool could look a lot like the tool for managing a chronic condition or a tool for improving overall post-event wellness.
For the chronic journey, the tool people are most interested in is one that uses their medical record and genetic data to improve initial diagnosis. For simple diagnosis, this is more likely a tool for their doctor(s) but for more complex diagnosis this tool is critical for both patients and doctors. For patients, the next-most impactful tool is one that helps them with controlling their condition using biometric data from a home health device or their smartphone to track their symptoms, medications and supplements and progress towards their personal goals for their condition. A smart tool ensures they have the right medication, maps out their preventative recommendations, helps them set the right health goals and make in-the-moment decisions. A genius tool would predict and help them mitigate flare-ups and comorbidity.
For the wellness journey, the tool people are most interested in is one that helps with setting personal goals that fit into their lifestyle and provides additional support for their initial motivation and when they are struggling. It would use wearable and emotional/motivation/mind-set data to know when they are struggling and provide support. An impactful wellness tool will also improve the discussion they have with their doctor during their wellness visit.
Set the stage
In designing digital tools to help patients, manufacturers should think holistically about patient journeys and look for places to include smart or genius digital tools. Keep in mind that standard journey work misses key points, especially where a digital health tool can be used and the type of data that should be collected. Currently, personal goals and emotional health data are underutilized in helping manage health and well-being. The increased use and expectations for digital health tools, combined with patients’ increased willingness to provide nontraditional data across their health journey, has set the stage for companies to design smart – and even genius – digital health tools to help patients and their health care practitioners improve health outcomes.