
Fairer and better
Editor's note: Jon Puleston is VP innovation at Kantar Profiles.
Demographic questions like age, gender and income are the bedrock of market research. We rely on them to target audiences, set quotas, purchase sample and ensure our research is representative. They are, in effect, a trading currency for the market research industry.
Yet there are no standards for how we measure them, with methods varying between market research companies and between countries. Anyone mixing sample from different sources can rarely be confident of getting a comparable spread. This also makes it difficult to reliably compare data between surveys.
Perhaps worse still, the lack of standards leaves us with no way to assess the accuracy of data. Over the last few years, I have studied the inherent biases in data by exploring the gap between survey answers and what we know from elsewhere. Sadly, some of the largest gaps can be observed in basic demographic questions.
This has been an elephant in the room of market research for several decades. It might represent one of the biggest inefficiencies holding back our industry.
A number of past attempts have been made to tackle this issue. They have failed for various reasons. Agreeing on global standards requires a heavy effort of coordination and funding. Many national methods of measuring demographics are firmly entrenched. Motivation has also perhaps been lacking, due to the relatively small proportion of cross-market compared to single-market research.
So what has changed? Why now? Marketing has become an international business with a greater volume of cross-market research and this has increased demand for standards. The harmonizing of sampling technology, along with automated sample supply, relies on consistent demographic standards to ensure efficient trading of sample.
Society is also changing. There is demand to improve the inclusivity of our research, to show that we can reach audiences from all walks of life and to demonstrate we’re measuring who we say we are.
Another barrier to establishing standards is the lack of convincing research-on-research evidence pointing us towards a solution. How should we best ask some of these demographic questions?
Over the past two years, my team at Kantar Profiles has conducted extensive research-on-research to find better ways of measuring basic demographics, with the goal of establishing best practice. We conducted over 50 comparative experiments in 15 different countries and carried out a large-scale evaluation and audit of global methods for measuring demographics and social class. Cross-evaluation experiments compared the efficacy of the main existing methodologies, alongside newer techniques we think might be more reliable.
In this article, I’ll present some of the learnings from this research, together with a view on the way forward, which I hope will prompt a fresh initiative in establishing global standards.
How to avoid asking non-inclusive demographic questions
The main challenge we face with demographic questions is getting realistic answers. Often there are big gaps between reported answers and what our wider knowledge leads us to expect (Figure 1). There are various reasons for this. Respondents might be embarrassed at revealing their age or lack of education, or might exaggerate earnings, or might simply find an answer hard to work out. And as we have discovered, these issues are exacerbated by how we ask the questions. 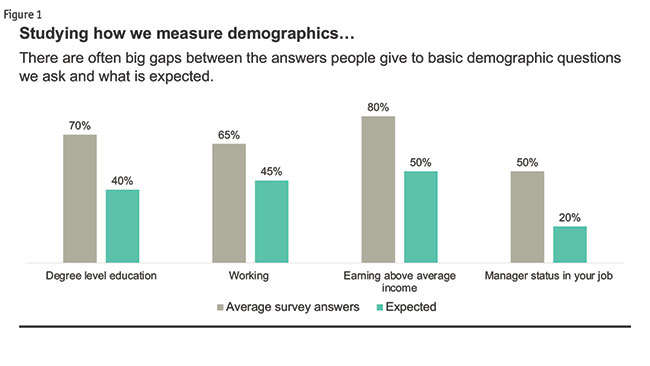
One of our initial realizations was just how biased, non-inclusive, hierarchical or patriarchal question wording can be. We ask, “What is your highest level of education?” implying that high is better than low. We ask, “Are you male or female?” which, unlike almost all other questions, has the options in a fixed order, male first. We ask about someone’s “working status,” assuming that everyone works, and associating “status” with “work.” The list below shows a great example of the standard question used in the U.K. to measure social class.
Please indicate what best describes your profession:
__ High managerial, administrative or professional
__ Intermediate managerial, administrative or professional
__ Supervisor, clerical, junior management, administrative or professional
__ Skilled manual worker
__ Semi-skilled or unskilled manual worker
__ Self-employed
__ Housewife/househusband
__ Unemployed
__ Student
__ Retired or on state pension
The language is archaic – who wants to tick a box saying they are unskilled? The use of “profession” assumes that a job is a vocation, while the first word on the list – “high” again – has status built in. Those who don’t work can only be described here as “unemployed” or “housewife,” both of which could be viewed as demeaning. As a result, the answers to this question prove to be highly distorted, with a disproportionate number selecting the top choices.
Another big issue we see are measures that quickly go out of date, such as income brackets that haven’t been adjusted to reflect inflation. Another example, used in many countries, attempts to determine disposable income by asking about household items of value. These lists can often be decades old and therefore meaningless as a predictor of wealth.
Some questions are simply difficult for people to answer. Someone working day-to-day might not know how to calculate their annual earnings, for example. We also see confusion between pre- and post-tax income, with most knowing the first much better than the second.
One of the biggest challenges, particularly for online research, is the length of lists. When asking a person’s occupation, a full list of options can fill six screens, making it difficult to find a particular job, especially when many can be described in multiple ways. Even so, with the multitude of different jobs in existence, these lists are often incomplete. (As a market researcher, you may well have encountered this challenge yourself – “Should I put ‘marketing’ or ‘data analytics’?”)
So what are the solutions?
How to ask people about their age
The first step is to think harder about how we ask demographic questions and the choices we present.
Take the apparently simple challenge of asking people their age. Most researchers understand that it matters how age ranges are presented. It’s usual to show them mid-decade to mid-decade (so 35-44, not 30-39), because while people tend to dread shifting up a decade, they’re less sensitive about the transition from, say, 34 to 35. But one often-ignored psychological aspect is how non-inclusive it is to cap the age ranges at, say, 65+. This implies researchers don’t care about anyone over retirement age. Consequently, we recommend that age bands go up to 95+. While few respondents will be that old, it helps make those in their 50s and 60s feel less ancient – and more likely to honestly report their age.
Similarly, the question, “How old are you?” contains an implied judgement about aging. We recommend avoiding the word “old” in the question.
The most reliable method to assess someone’s age is to avoid the direct question altogether and instead ask year of birth. Respondents seem to report this more honestly, perhaps because it’s perceived as less judgemental or perhaps because it’s less prone to accidental error. Some people may genuinely forget how old they are.
How to ask people about their education
Claimed education level provides one of the highest observable discrepancies between online survey answers and country population demographics. Many more people claim in-survey to have a degree than is theoretically possible from our knowledge of published data. This is an endemic issue in every country measured, with upwards of 30% overclaim in degree+ education levels.
The reason for this, as highlighted earlier, is the way we ask the question, “What is your highest level of education?” With the implication that “high” is best, it’s unsurprising that some people who don’t have a degree click the box to say they do, especially given no one is likely to check. Nobody wants to come across as stupid, even to faceless market researchers.
Our proposed solution is to ask in a more roundabout way. We recommend firstly asking people what they did when they left school.
What did you do after leaving school?
__ Looked for a job/started work
__ Took up an apprenticeship (or job with training)
__ Went on to do more education/training
__ Pursued my own goals
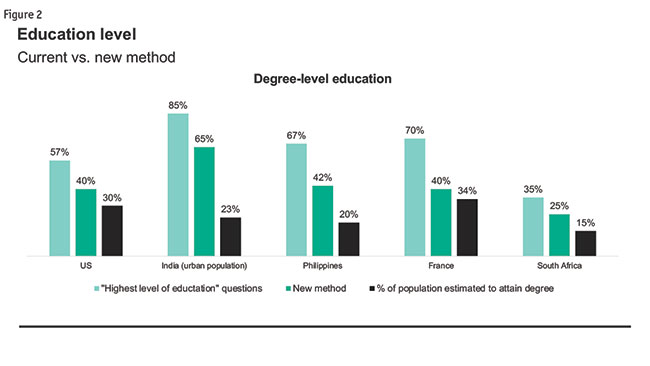
By avoiding the apparent assumption that people go on to higher education, far fewer seem to feel the pressure to say they did so. Rather than, “What is your highest level of education?” we recommend asking what type of further education they undertook and whether they attained any qualifications from this.
Shifting the approach like this produced data far closer to best estimates of known education levels in every country we tested (Figure 2).
How to ask people about their work status
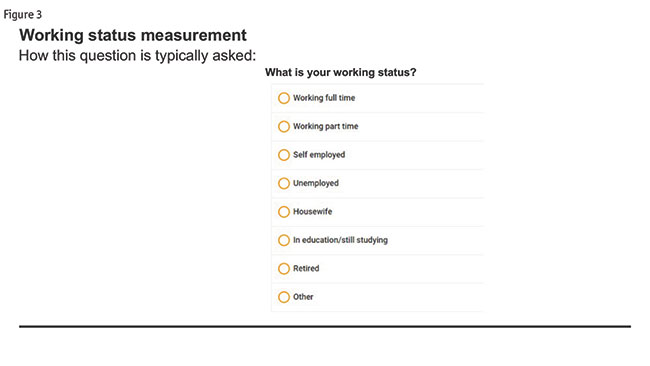
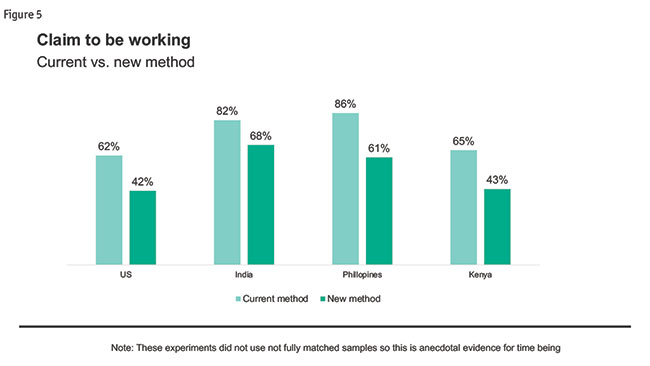
Working status is another common demographic question often asked in a non-inclusive way. The list of options for “What is your working status?” usually has “working” at the top (Figure 3), with non-working lifestyles reduced to a choice between “unemployed” or “housewife.” Many non-working people would be unhappy identifying as either of these.
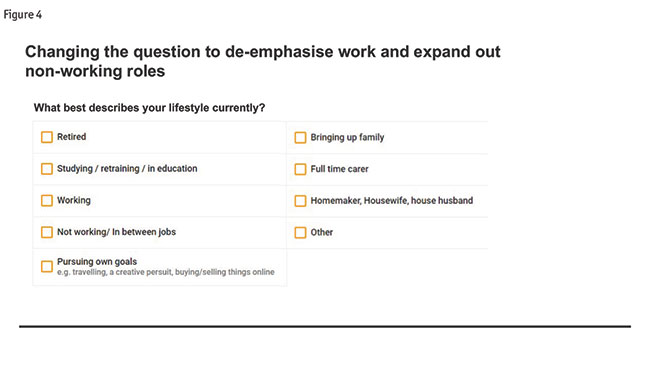
We recommend changing the question slightly to remove direct references to work and status and deemphasize work by placing it in among the other choices. We suggest expanding the non-working roles to include “bringing up family,” “full-time carer” and “pursuing own goals,” and taking care to include the full range of “housewife”-type roles (Figure 4). We suggest adding a tip to explain what “pursuing own goals” might be, to help make this feel a legitimate and respected choice. We also recommend making this question multi-choice, as people may well be doing more than one.
With this change of approach, every country we tested showed significant drops in the number of people feeling the need to claim to be working (Figure 5).
How to ask people about their employment
Finding out what people do for a living is the most complicated demographic to measure in-survey. Job lists can stretch to hundreds of choices, with many unique jobs almost impossible to group and classify. People think about and describe their jobs in many different ways, some identifying themselves by industry (“I work in banking”), some by role (“I work in HR”), others by status (“I am a director”).
As part of this research, we asked 500 people in five different countries to describe their job and then try to find it on our standardized list of about 200 occupations. One in five people said they could not find theirs. Of those who did, less than half directly matched their own job description.
Many of their jobs simply were not on the list. Jobs and their definitions are evolving all the time – social media, for example, has spawned a whole range that didn’t exist a decade ago and these were missing from the list we tested. What with the number of different lists used by researchers around the world, I think everyone in the industry could benefit from one that is standardized, optimized and kept up-to-date.
Our solution would be to use a more effectively grouped job list with drop-down choices. The first is a broad set of industry categories, within each of which is a clear set of sub-industry categories, with icons to help identify them. See example in Figure 6.
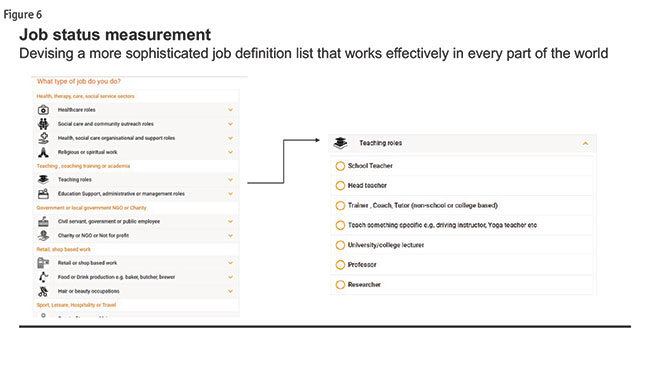
Once a person selects the broad industry category, they are presented with the third tier, a drop-down list of specific jobs, such as the “teaching roles” section of Figure 6. There is also room in this methodology to ask about job status where relevant. For further detail, we also recommend asking follow-on questions about the number of people the respondent manages, worded in an inclusive way. And, recognizing that many people now have more than one job, we recommend asking respondents whether they have a second job, and if so, what it is.
We carried out several waves of multi-country research to try to perfect the list of jobs we present to people but we aren’t quite there yet. One list achieved a 95% correct job attribution in the U.S. and U.K., but when tested in four other English-speaking countries around the world (Singapore, Philippines, India, South Africa), this fell to 82%. Further, when translated into Portuguese and tested in Brazil, it fell to 77%. This highlights the combined challenge presented by unique jobs in specific countries and unique job descriptions in specific languages and points to the need for an industry group to do further research and create reliable job lists.
How to ask people about their income
Income assessment is one of the most common demographic questions but probably the most unreliable of those we researched.
For those in regular full-time paid employment, assessing one’s income is a relatively simple process. But for many people, it can be a challenge, such as those who work variable hours, are freelancers, have more than one source of income or who rely on benefits to top-up earnings. Our research estimates that only half of people appear able to reliably report their income.
Then there’s how to measure it. If the industry were to standardize one demographic measure, I’d beg for it to be income. At present, most researchers ask this question with a seemingly random set of income bands that are often badly out of date and there are so many different ways of asking: annual income, monthly, pre-tax, post-tax. Some ask about personal income, some about household and some about head of household.
It would be so useful if we could all agree on not only standardized measures country to country but also a cross-classification protocol that divides each country’s income earners into percentile groups. Our industry would also benefit from a process whereby income bands are reviewed and updated yearly.
Taking the various ways of measuring income and comparing each with a broader assessment of a person’s disposable wealth, we found that asking for monthly income, after tax and deductions and for the household, is more reliable than annual, pre-tax or personal income (Figure 7).
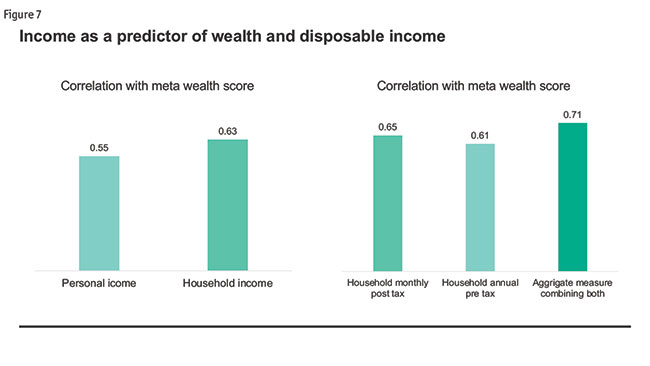
However, we found that because of the difficulty people have in answering this question, the most reliable approach was to ask both monthly post-tax and annual pre-tax income and combine the scores.
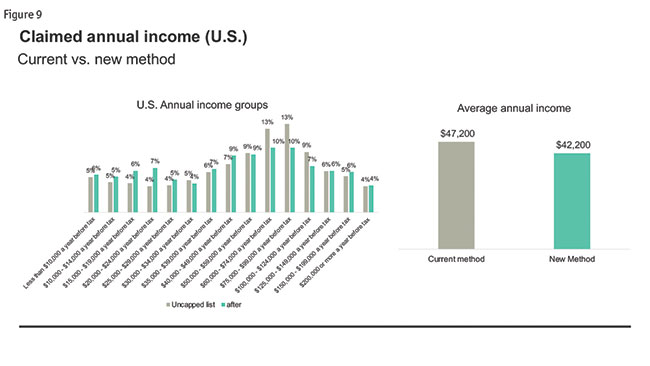
Part of the reason income does not correlate more closely with measures of meta-wealth is that it’s subject to high levels of overclaim. Our basic solution is to cap the displayed income bands at half the average median income (Figure 8). To those who earn more than half, we then present a second-tier list of higher income brackets. This helps people on lower incomes feel less far down the scale.
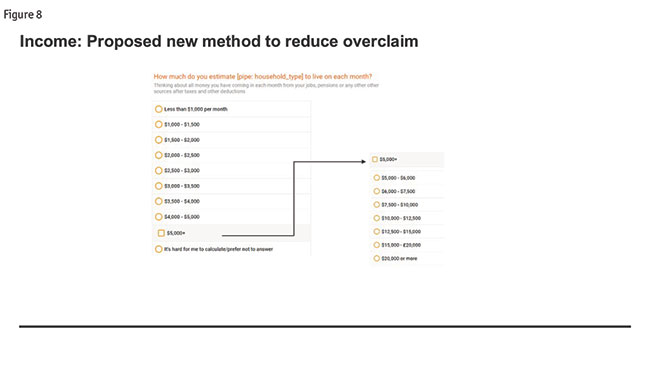
As you can see from a comparison in Figure 9, this reduces the number of people claiming to be in the higher income groups.
How to ask people about their socioeconomic status
Socioeconomic measurement techniques have troubled researchers for decades. Devised in the 1950s, they have since slowly become outdated and archaic. Despite their flaws, however, we are largely stuck with them. They have become embedded in research ecosystems around the world, used as trading currencies for media and form the fabric of giant-scale social research programs.
But could we refine and improve them? The main challenge is that every country has its own methods of measurement, many highly idiosyncratic.
As part of this research, we undertook an audit of social class measurement in 44 countries around the world to identify unifying themes. No two countries use exactly the same method but we identified five thematic approaches, with each country using a different combination to arrive at an overall measure: income-based; education and job classification; house type and living circumstances; spending power; and items of value in household.
Each has its issues. The first two methods have been covered above. The others are explored here.
Assessment of housing and living circumstances is used extensively across Latin America, Southeast Asia and parts of Africa. Questions are asked about the type of house and number of rooms, the type of roofing and flooring, whether or not there is an electricity supply or plumbed-in water, even how many lightbulbs there are. This does not translate well into the realm of online research, where taking a survey online relies on using a device that requires an electricity supply.
Assessing spending power is used extensively across formerly communist Eastern Europe and Russia. Respondents are asked how much of their household income they spend on food and what else they can afford to buy, such as new clothes, a large electrical item, a car or a house. This is quite a simple and effective technique, rivalling asking people their income. Like many other measures, it is subject to overclaim but a greater challenge is the difficulty in making it internationally comparative. What a typical person in a Western economy can afford to buy differs greatly from what one might afford in a developing economy.
An audit of items of value in household is a popular technique used in a number of countries, notably India and South Africa. People are presented with a curated list of items of value and asked which their household includes. This simple and adaptable technique is quite effective at predicting someone’s wealth, on a par with asking household monthly income. But again, this question suffers from overclaim, and is highly reliant on having a well-curated and current list of items.
Overall, our research found that the most effective assessments of wealth focused not on income but on a person’s expenditure. Asking what people pay for seems to promote greater honesty than with ownership-based questions. Far fewer people are untruthful about having to pay for car insurance than about owning a car.
This expenditure-based method beat all other examined techniques as a means of predicting meta-wealth scores, with the answers correlating at 0.75 (Figure 10). 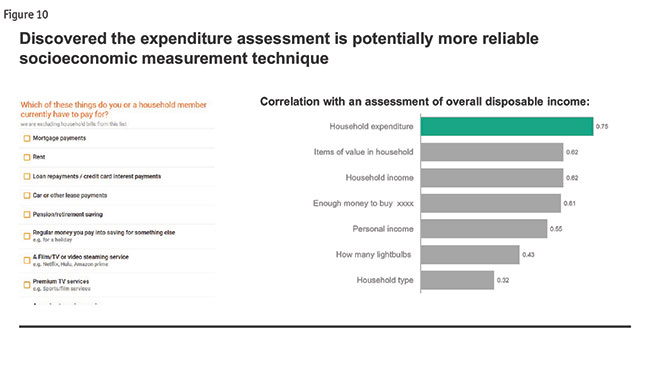
Marketing research has a great opportunity
Our industry has a great opportunity to improve how we measure basic demographics by making simple refinements to how we ask these questions and thinking differently about what we measure. The recommendations made in this article may not be the exact solutions but I hope this work helps point the industry in the right direction.
I have written this article as a member of the ESOMAR Professional Standards Committee, who have agreed to set up a new committee to tackle this issue made up of representatives from all parts of the global research industry. The plan is to look for common ground and try and establish and endorse global standards where we can find consensus one question at a time. I am really hopeful that we can make some progress on harmonizing our industry’s approach to measuring demographics moving forward.
I am grateful for the support of Quirk’s on this initiative, in inviting me to publish this article.