Editor’s note: Vinayak Nair is the VP of custom analytics at Verto Analytics. This is an edited version of a post that originally appeared under the title, “Chart of the week: How reliable is claimed data for measuring Spotify usage?”
“Surveys show that surveys never lie,” is a saying that you may have seen before. It can be interpreted multiple ways and one is that surveys, even if they are properly designed to extract pertinent information, are not perfect because they inherently have bias in some way, shape or form. If you have ever relied on research to make decisions, you already know this about surveys. That’s not to say that surveys don’t have benefits, such as explaining the “why” behind the way respondents think, establishing segmentation, etc. However, when the scope of a survey expands beyond that purpose, such as to quantifying claimed behavior, we begin to see the limitations of survey research.
One of the ways to help alleviate surveys bias is to replace or supplement with actual behavioral data. We have fielded survey data meant to mimic behavioral data in order to show where similarities and differences occur. In this example, we will look at claimed vs. actual behavioral data behind the usage of audio streaming service Spotify.
To compare claimed vs. behavioral data, we asked panelists to best describe their Spotify usage habits in a survey by choosing one of the following:
- Never tried
- Tried, but no longer using very often
- Using monthly
- Using weekly
- Using daily
With the metrics listed below, we compared respondents’ stated use to their actual use.
- Average Spotify sessions (past six months)
- Average number of active days (past six months)
- Average Spotify sessions per active day (past six months)
How did the data line up?
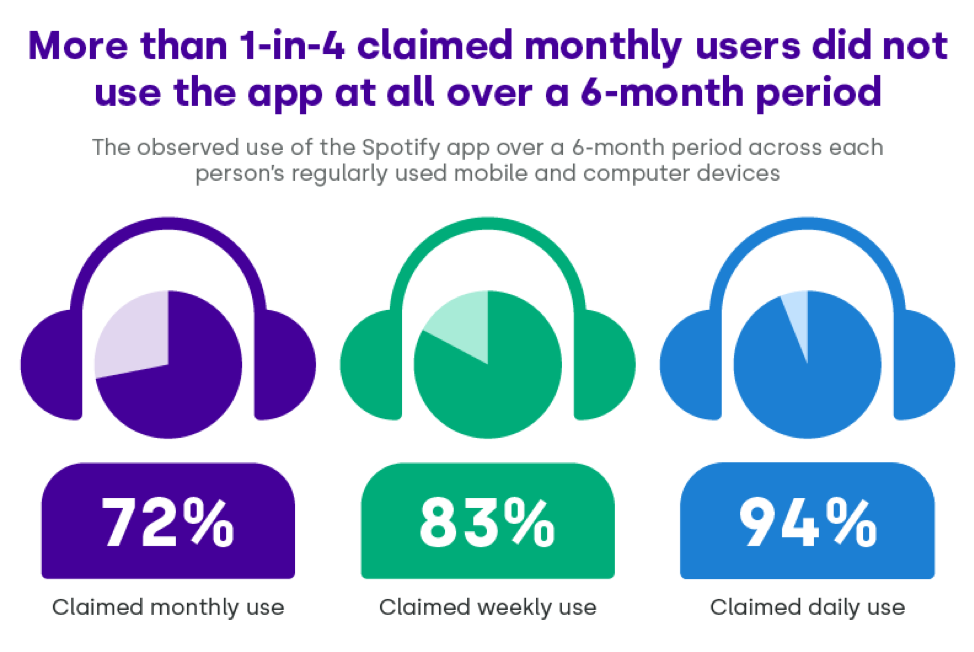
We aligned claimed daily, monthly and weekly use of Spotify at a responder level vs. actual use of the service across the last six months since they took the survey. What’s interesting is that 28% of responders who claimed monthly usage did not use the app at all on PC, smartphone or tablet.

Among those claiming to use Spotify daily, just about all actually had some observed cross-device Spotify usage (94%) – even if it was not as often as they claimed as later charts will show. However, as the claimed usage incidence decreased, so did the accuracy behind the claims: only 83% of those who claimed weekly usage had actually used Spotify, compared to 72% of those who claimed monthly usage.
When we take a closer look at how claimed usage aligns with actual usage, we see quite a bit of overlap among those claiming to use Spotify daily, weekly and even monthly.
In the graph below we compared respondents’ behavioral usage of Spotify. If people were accurate in their surveys, we’d expect to see the monthly users cluster around six days of use, the weekly users cluster around 24 and the daily users cluster around 180. But instead, we see a large overlap – there are claimed daily users who are less engaged in Spotify than those who claimed they were monthly users, and monthly users more engaged than claimed weekly users.
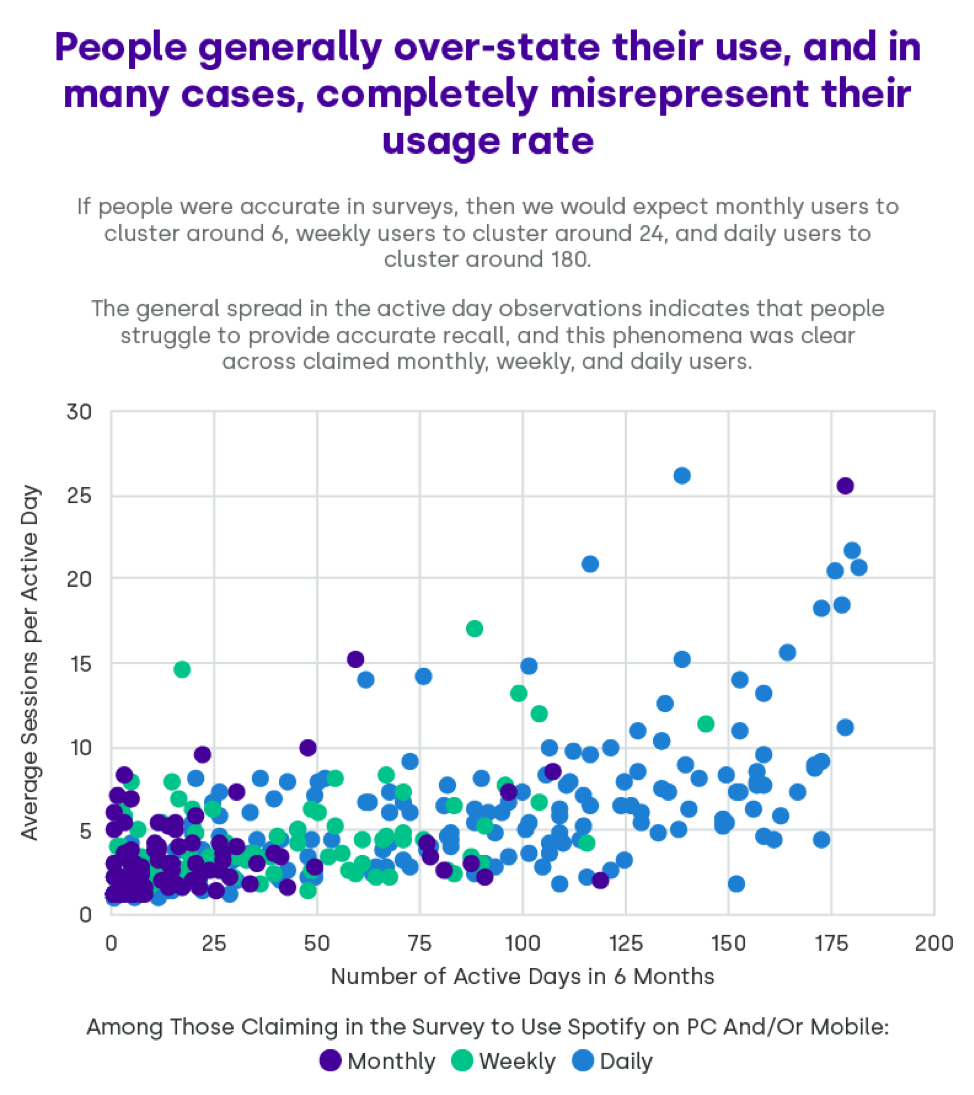
Even while those who claimed they were daily users of Spotify are more likely to actually have used Spotify, people struggle to recall their actual frequency of use. We saw this across those who claimed to have used Spotify monthly, weekly and even daily.
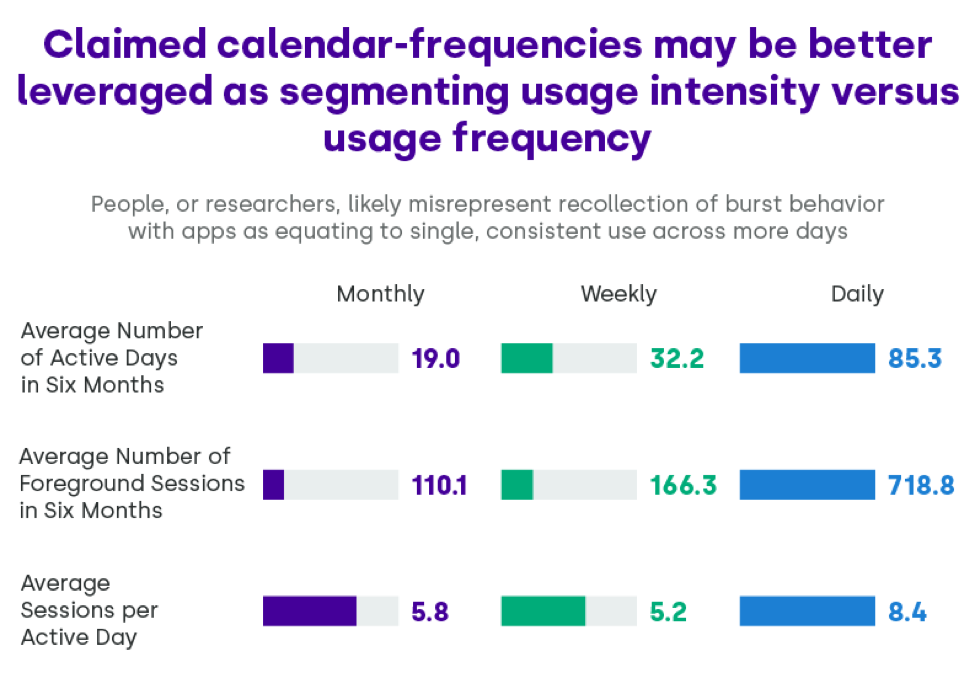
If we break down the claimed users based on summary stats, we see that the claimed daily users of Spotify do have higher intensity given the 8.4 average sessions on days the app is used. However, the average number of active days among responders who claim daily usage is only 85 out of a possible 183 days. This shows that people are more likely to recall usage intensity or bursts of activity as opposed to consistent usage across days.
So what does this mean? Surveys are still very useful to understand why someone takes an action. But the more granular you get in asking people to recall how often they do certain things, the more error you’ll get in your reporting. Using cross-platform behavioral data provides the clearest picture of actual consumer behavior.