Portrait of a researcher
No two researchers are alike, that's for sure. But it sometimes seems like as a group they don't change much. After a decade of fielding our Q Report survey of client-side Quirk's readers, one of the most surprising outcomes has been how consistent the data has been from year to year on some of the questions we ask (job satisfaction levels, staff sizes, etc.).
For this issue's deep dive into the Q report findings, we present a snapshot of a Quirk's corporate researcher reader, drawn from data gathers for our most recent Q Report *fielded in 2023), based on survey responses from 707 client-side researchers.
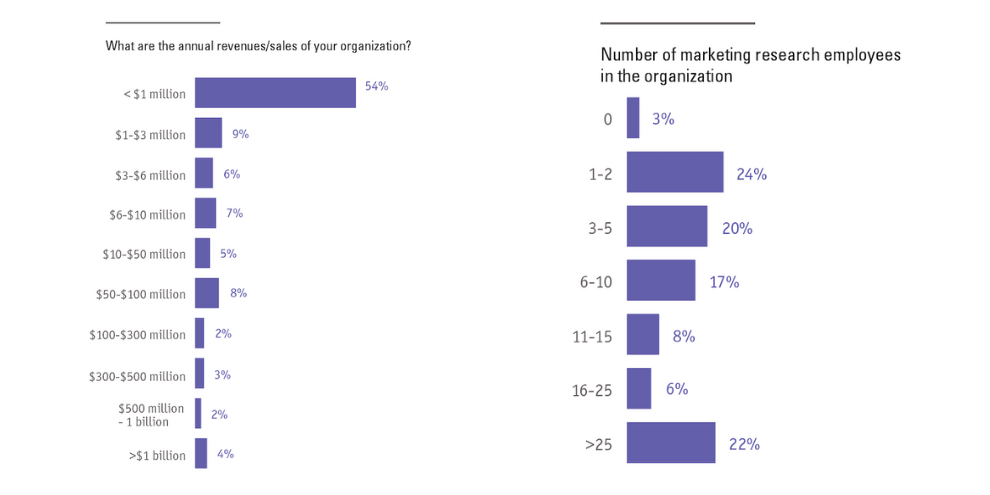
Number of marketing research employees in the organizations
Not much has changed over the past 10 years. In 2013, 27% said 1-2; 27% said 3-5; 15% said 6-10; 14% said more than 25.
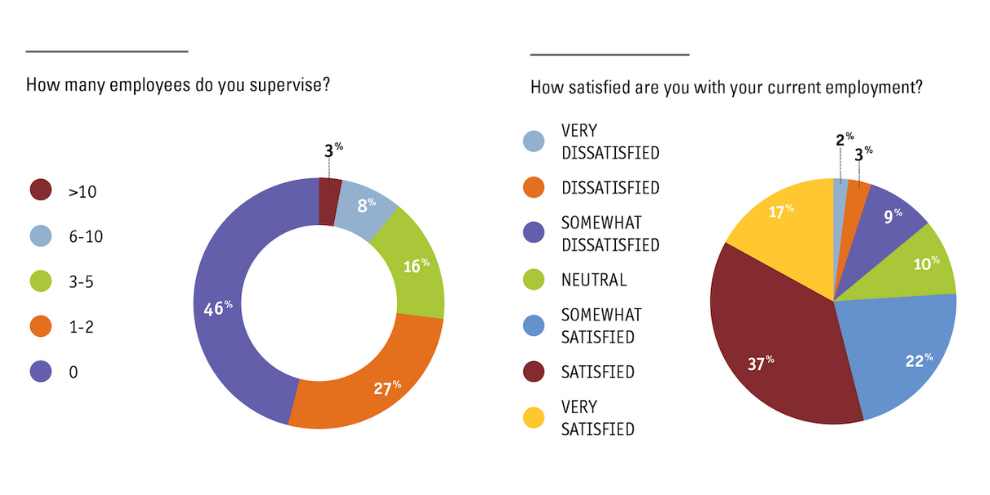
How many employees do you supervise?
It’s always been kind of mind-boggling how small the insights departments are (if you can call one person a department!) in billion-dollar organizations but these levels have been consistent over the years. Talk about doing more with less!
How satisfied are you with your current employment?
Hard to know what to attribute it to (maybe it’s as simple as researchers just happen to like their jobs?) but 2023’s levels are remarkably similar to 2013’s: 37% satisfied; 19% very satisfied; 9% somewhat dissatisfied; 5 % dissatisfied.
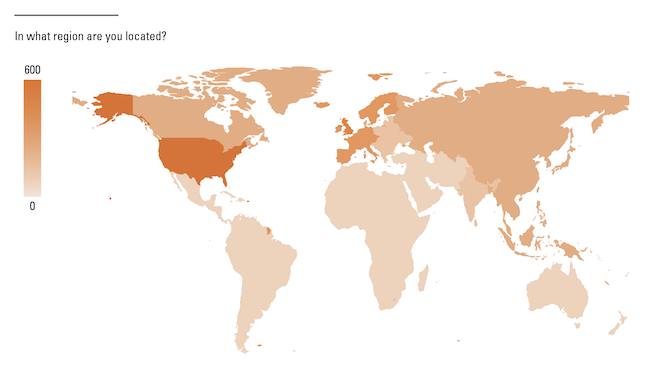
In what region are you located?
As expected, with a U.S.-based, English-language publication, respondents are largely located in the U.S. (81%), U.K. (7%) and Canada (3%), with Western Europe at 4% the largest readership group after that.
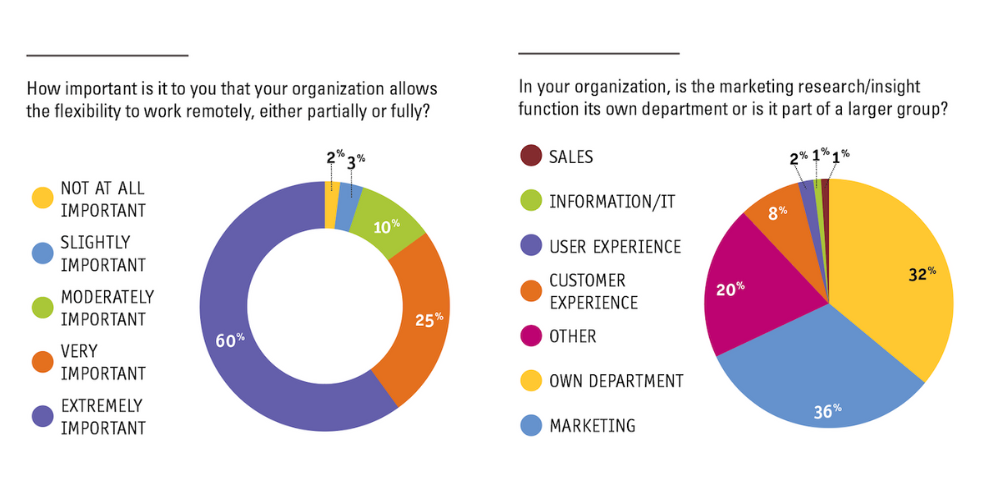
How important is it to you that your organization allows the flexibility to work remotely, either partially or fully?
Like most office workers, researchers don’t want to return to the old days of being bound to their cubicles. A combined 85% say that the ability to work remotely either fully or partly is extremely/very important.
In your organization, is the marketing research/insight function its own department or is it part of a larger group?
In a related open-end, some respondents indicated that research’s place in the company has generally stayed the same, with moves into strategy, analytics or CX as the most-cited internal umbrellas.
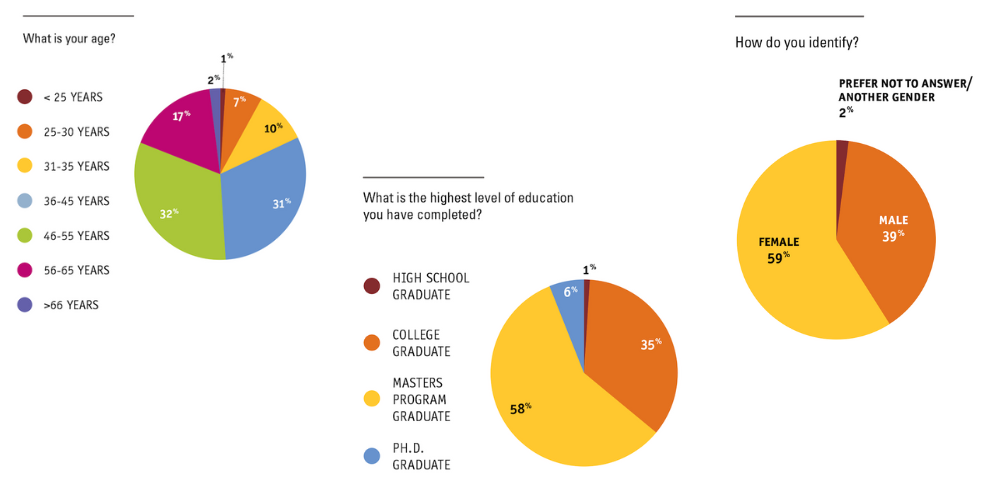
What is the highest level of education you have completed?
Again, these levels are almost identical to those from 2013 – 57% master’s and 35% college graduate.
Methodology
The Q Report work life and salary and compensation study of end-client/corporate researchers is based on data gathered from an invite-only online survey sent to pre-qualified marketing research subscribers of Quirk’s. The survey was fielded from May 24 to July 10, 2023. In total we received 1,969 usable qualified responses of which 707 were from end-client researchers and used for this end-client report. An interval (margin of error) of 2.17 at the 95% confidence level was achieved for the entire study. (Not all respondents answered all questions.)