Overcoming obstacles
Editor's note: Erwin Chang is director of special studies at Magaña Research Worldwide, Los Cabos, Mexico.
The population of unauthorized Hispanic immigrants in the U.S. is considerable and ranges between 11 and 22 million people1,2,3. However, there has been a lack of nationwide quantitative studies based on the perspectives of unauthorized Hispanic immigrants regarding their immigration stories, life, perceptions and attitudes towards American culture and society. As a result, it is hard to understand the main problems created by this social phenomenon and to find plausible solutions.
Thus, the study profiled in this article tries to close the knowledge gap by focusing on various topics related to unauthorized Hispanic immigration in the U.S., including what would make the immigrants return to their country of origin; factors that influence their lives in the U.S.; crime; their political orientation; and their perspectives on the Trump administration.
Finding and convincing
One reason that prevents research organizations from conducting studies with unauthorized Hispanic immigrants in the U.S. is the difficulty of finding and convincing them to participate in a study. For instance, they may be afraid of talking to undercover officials from the U.S. government’s Immigration and Customs Enforcement (ICE) agency and refuse to identify themselves as an unauthorized or undocumented immigrant.
Moreover, they learn that it is better to hide their immigration status to get or keep a job and do not want to be regarded as a type of pariah. Therefore, they feel uneasy taking part in this type of study.
Another challenge involves obtaining data that is representative of the unauthorized immigrant community. Although it might be easy to intercept Hispanics at Hispanic shopping centers, such data might be deemed neither adequate nor representative since it will be limited to certain demographics.
Online surveys are not an option either as it is not possible at this moment to find a panel provider that can provide enough sample size to represent unauthorized Hispanic immigrants from different countries of origin throughout the U.S.
However, computer-assisted telephone interviewing (CATI) has an advantage in that the phone number universe includes most/all phone owners, regardless of their language or their immigration status. Moreover, CATI is more representative than intercepts as it covers the entire U.S. continent rather than only a few small areas. Therefore, contacting unauthorized Hispanic immigrants by phone was the optimal method for this study.
The best approach was to call 75% of the prospective respondents by cellphone and 25% by landline in unacculturated Hispanic areas. Pay-as-you-go cellphones were also targeted because Social Security identification is not required to acquire them.
Nonetheless, this method also had its challenges. The most difficult one was gaining enough trust from the respondents to prevent them from hanging up or lying to interviewers when asked questions regarding their immigration status.
This was overcome by carefully selecting phone interviewers and scripting what they would say to fight refusals, overcome objections and gain the trust of participants. With that in mind, the interviewer team consisted of formerly unauthorized Hispanic immigrants who would be more empathetic with participants and more capable of building good rapport. All were bilingual and were recruited in Mexico, where the call center was set up.
The script that interviewers had to recite to introduce the study and gain trust was also key to keep participants answering the survey questions. It was developed with pre-tests and post-tests conducted to improve the previous wordings and increase the ratio of the number of successful interviews vs. the total number of calls.
Two pieces of explanatory text were included in the questionnaire. One was part of the introduction and the other was placed just before the question related to the immigration status of the participant. They included various important notices:
- that the organization behind the study is private and not part of the government or any of its agencies;
- that the survey includes sensitive personal questions;
- that answering the survey will enhance a better understanding of the immigrant Hispanic community and thereby allow organizations to use the study to improve policies and relations with Hispanic immigrants; and
- that their identities will be kept confidential and that the data captured will not include full names, addresses or other personally identifiable information.
The use of the right scripts by the right interviewers provided a significant increase in the response rate among unauthorized Hispanic immigrants.
Three groups
 The status of unauthorized Hispanic immigrants in the U.S. can be divided into three groups. The first group is known as undocumented. It comprises the largest population of Hispanic immigrants and represents almost two-thirds of unauthorized Hispanic immigrants in the country. The second group, about a quarter, consists of those in the process of obtaining legal status if approved. The third group comprises around one-tenth and includes the recipients of the Deferred Action for Childhood Arrivals (DACA) status. DACA beneficiaries were included as unauthorized Hispanic immigrants because DACA does not provide lawful status according to the U.S. Citizenship and Immigration Services.
Information on why unauthorized Hispanic immigrants came to the U.S., how they managed to get into the U.S. and what might cause them to return to their country of origin is also essential for understanding other aspects of the unauthorized immigrant’s life.
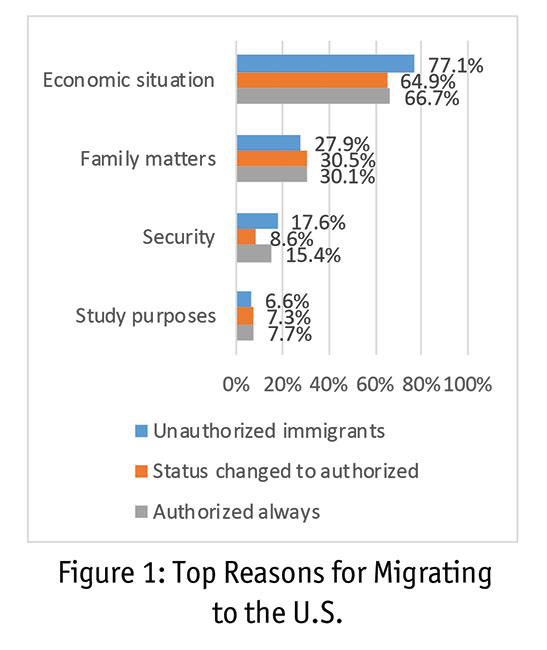
Two questions were posed to them during this study. One was intended to collect data on respondents’ reasons for migrating to the U.S. and the other sought to identify which of the reasons provided was the most important. For both questions and the three Hispanic immigrant segments, the reason most frequently mentioned was the economic conditions in their country of origin, as illustrated in Figures 1 and 2.
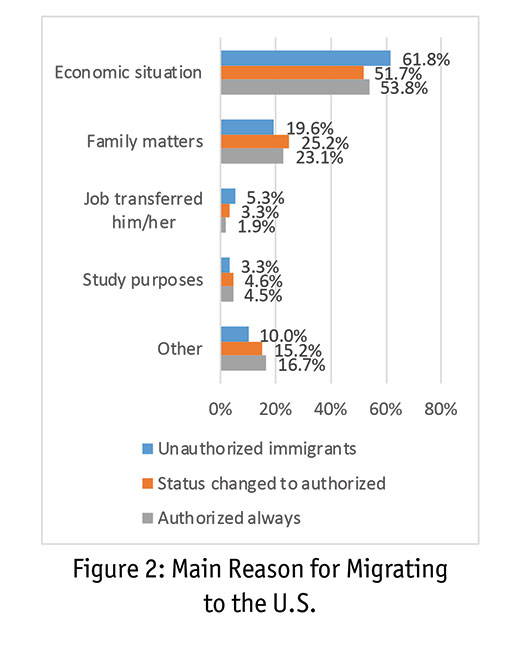
Family issues emerged as the second-most pressing matter after the economic situation for both questions and the three segments as well. Security emerged as the third reason, with the majority of respondents mentioning it when asked all the reasons which made them move to the U.S. Nonetheless, security dropped to fifth place when asked for the main reason for migrating.
Another important reason for migrating is that some Hispanic immigrants came to the U.S. because their job required them to move there. Some decided to overstay beyond their work permit dates, while others found a way to continue being in the U.S. legally. This was the most important reason for migrating for one out of 20 unauthorized Hispanics and ranked third among the main reasons for migrating to the U.S.
The interviewees also mentioned the means by which they entered the U.S. The majority, two-thirds, entered the country with no documents by evading U.S. border controls. However, 23% of unauthorized Hispanic immigrants entered the U.S. with a non-immigrant visa that granted them a temporary stay in the U.S. More than one out of 20 unauthorized Hispanic immigrants entered the U.S. by passing border controls with another person’s documents.
 To understand the reasons for immigration from another perspective, and learn the attitude of immigrants towards any change of plans regarding their current residence in the U.S., this study asked participants for reasons that could cause them to return to their country of origin. This information was captured using a multiple-choice question and the answers were consistent with the reasons to migrate.
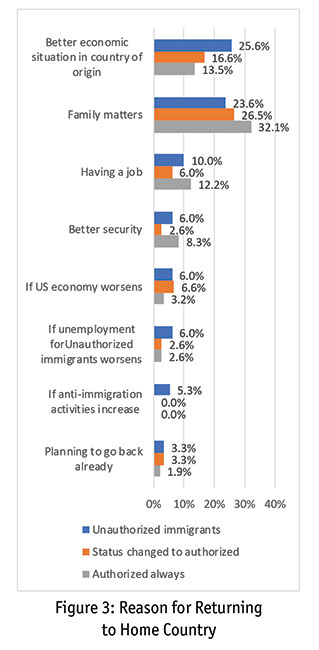
The top reason, given by a quarter of unauthorized Hispanic immigrant respondents, was the improvement of the economy in the country of origin. The second reason was family matters, raised by 24% of the respondents, as presented in Figure 3.
Having a job waiting for the unauthorized immigrant in the country of origin was another reason mentioned to return to the country of origin, with one out of 10 unauthorized Hispanic immigrants mentioning it.
As evident in Figure 3, only 3.3% of unauthorized Hispanic immigrants have plans to return to their country of origin. This figure suggests that the vast majority of unauthorized Hispanic immigrants came to the U.S. to permanently reside.
Life in America
Life in the U.S. has changed the modus vivendi of many unauthorized Hispanic immigrants. This opens a box with many questions of interest to better understand how unauthorized Hispanic immigrants live in the U.S. and what they think about life in America.
Unauthorized Hispanic immigrants are more likely to have a job (83%) than authorized immigrants (62%-64%). This phenomenon is consistent with the fact that the main reason for unauthorized Hispanic immigrants to come to the U.S. is the economic situation in their home country.
Those who are currently employed work around 45 hours per week on average, just one hour less than Hispanic immigrants who have always had authorized status.
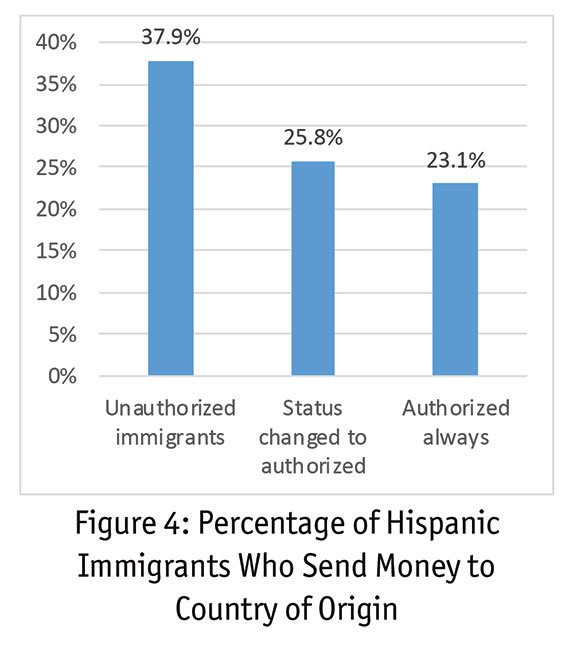
While some critics argue that immigrants sending money back to their home country is not beneficial to the U.S. economy, immigration supporters note that unauthorized immigrants actually spend the largest proportion of their income in the U.S. and in so doing, greatly contribute to the U.S. economy.
Our findings show that 38% of unauthorized Hispanic immigrants send money to family and friends in their country of origin. This percentage is higher than the 26 percent of authorized Hispanic immigrants who say they do so and the 23 percent of those who were always authorized who do so (see Figure 4).
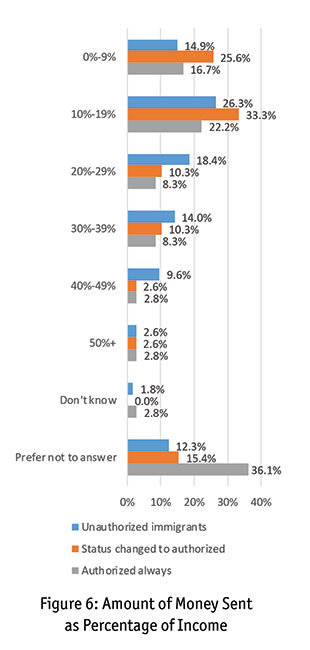
The money sent to Latin America usually goes toward basic needs such as buying food and paying utilities. This pattern is especially true for unauthorized Hispanic immigrants, as three-quarters of them send money for food, over 70% of them send money for utilities and 45% send for education, as shown in Figure 5. Figure 6 shows the percentages of income sent to their country of origin by the various groups.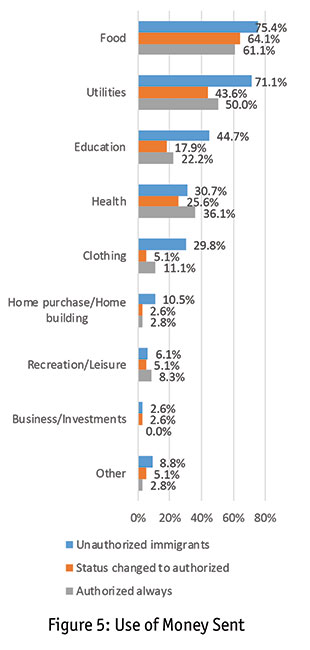
Law enforcement attitudes
This study also tried to uncover the attitudes of unauthorized Hispanic immigrants concerning law enforcement. The questions were related to their willingness to assist police or report an incident if a crime occurred. Respondents had five choices to select for each question in addition to the “don’t know” option. The alternatives went from “definitely I will assist [the police]” to “definitely I will not assist [the police].”
While the majority of authorized Hispanic immigrants will “definitely” assist the police if they witness a crime, less than 20% of unauthorized Hispanic immigrants stated the same. The rating differences between unauthorized and authorized Hispanic immigrants are considerable on this question. Nonetheless, this situation could present an opportunity to create an alliance between unauthorized Hispanic immigrants and local police to improve public safety.
Moreover, the percentage of unauthorized Hispanic immigrants who said that they would “definitely not” or “probably not” assist the police is higher than the percentage of those stating that they will “definitely assist” or will “probably assist” the authorities.
 Unauthorized Hispanic immigrants are also less likely than authorized Hispanic immigrants to report a crime to the police, even if they were the victim. The percentage of those who would “definitely not” report or who will “probably not” report being the victim of a crime is higher than the percentage of those who stated that they would “definitely” or “probably” report an incident to the police among unauthorized Hispanic immigrants.
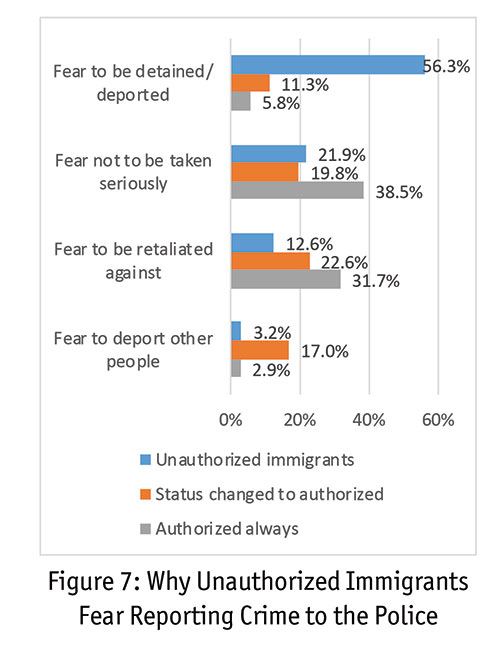
The reason most frequently stated (56%) by unauthorized Hispanic immigrants for not reporting a crime or assisting the police is the fear of being detained or deported. This piece of data may be the key to developing policies that can help communities enhance public safety.
A fifth of unauthorized Hispanic immigrants said the reason they would not report a crime or assist the police is the fear of not being taken seriously.
The willingness of unauthorized Hispanic immigrants to help authorities solve crimes is substantially lower than the willingness of authorized Hispanic immigrants. Thus, law enforcement may need to develop new approaches to gain the trust of unauthorized Hispanic immigrants and enhance their confidence in law enforcement agencies. Figure 7 shows the reasons cited by Hispanic immigrants for not reporting a crime to the police.
Opportunities for a better life
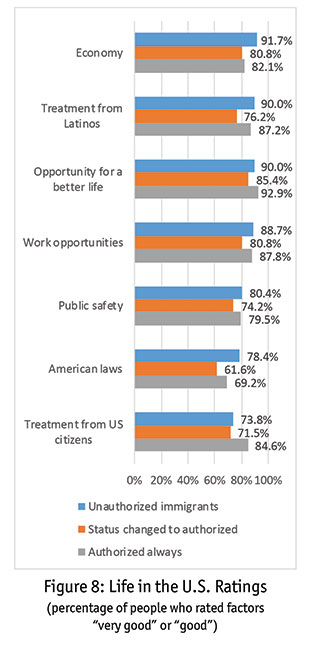 The study also sought to identify factors that influence the life of Hispanic immigrants in the U.S. The factors explored include the economy, treatment from other Hispanic people, opportunities for a better life, work opportunities, public safety, American laws and treatment from U.S. citizens. Interviewees had to rate the factors in a five-point scale, plus the “don’t know” option. The alternatives of the scale were “very good,” “good,” “neutral,” “bad” and “very bad.” Figure 8 shows the percentage of respondents who rated the factors very good or good (top-two box).
The majority of Hispanic immigrants rated the factors as very good or good, implying that they have positive perceptions of these important factors. The U.S. economy received the highest ratings by unauthorized Hispanic immigrants as over 90% of them said that the economy is either very good or good. The treatment from other Latinos and the opportunity for a better life also received high ratings, as 90% of unauthorized Hispanics rated such factors as very good or good.
Generally, unauthorized Hispanic immigrants gave higher ratings to these factors than authorized Hispanic immigrant except for one question, the one related to treatment from U.S. citizens.
Consistent with the last set of questions, the vast majority of Hispanic immigrants interviewed in this study expressed that their lives have improved in comparison to their life in their country of origin. Indeed, almost two-thirds of unauthorized Hispanic immigrants stated that their lives “improved a lot” while about a third of them said that their lives had improved somewhat compared to life in their country of origin. The findings also show that unauthorized Hispanic immigrants felt that their lives had improved more than the life of any other group engaged in the study.
Even though their lives have improved and data suggest that they are not planning to go back to their country of origin, lawful Hispanic immigrants are less likely to become U.S. citizens than other immigrant groups.
Politics in the U.S.
The research team was also interested in understanding the perceptions of unauthorized Hispanic immigrants regarding politics in the U.S. The findings demonstrate that unauthorized Hispanic immigrants are less likely to support a political party, as almost half of them (46%) stated that they either do not support any political party or they do not have a political opinion.
Unauthorized Hispanic immigrants who support a political party represent less than a third of all unauthorized Hispanic immigrants surveyed. On the other hand, authorized immigrants are likely to support a political party. This attitude is especially true among those who have always been authorized, as two-thirds of them support a political party.
When Hispanic immigrants who support a political party were asked which political party they support, most of them, from all three segments, stated that they support the Democratic Party.
Unauthorized Hispanic immigrants are more likely than the other two Hispanic immigrant groups to support the Democratic Party. The findings show that 82% of unauthorized Hispanic immigrants support the Democratic Party compared to 76% and 66% for authorized Hispanic immigrants who were unauthorized before and for authorized Hispanic immigrants who have always been authorized, respectively.
The study also examined the perceptions of Hispanic immigrants regarding 21st century presidential administrations. It asked to rate administrations on a five-point scale that ranged from “very good” to “very bad.” Consistent with the political party that Hispanic immigrants follow, Barack Obama was the president with the highest percentages of positive ratings. Two-thirds of unauthorized Hispanic immigrants stated that Obama’s administration was either good or very good.
On the other hand, President Donald Trump received the lowest positive ratings of any other recent U.S. president. The outcomes indicate that only 11% of unauthorized Hispanic immigrants stated that his administration was good or very good. Trump also stood out as the president with the highest percentages of negative ratings. The study findings showed that half of the unauthorized Hispanic immigrants rated Trump’s administration as either bad or very bad.
In contrast, only 3% of unauthorized Hispanic immigrants affirmed that Bush’s administration was bad or very bad, while less than 2% indicated that Obama’s administration was bad or very bad.
References
1 M.M., Fazel-Zarandi, J.S. Feinstein and E.H. Kaplan, “The number of undocumented immigrants in the United States: Estimates based on demographic modeling with data from 1990 to 2016.” PLoS One, vol. 13, p. e0201193, 2018.
2 Pew Research Center, “Unauthorized immigrant population in the United States, 1990-2016.” 2017.
3 Pew Research Center, “Estimates for 2005-2015 based on augmented American Community Survey Data (IPUMS); For 2016 and 1995-2004 Based on March Supplements of the Current Population Survey.” 2013.